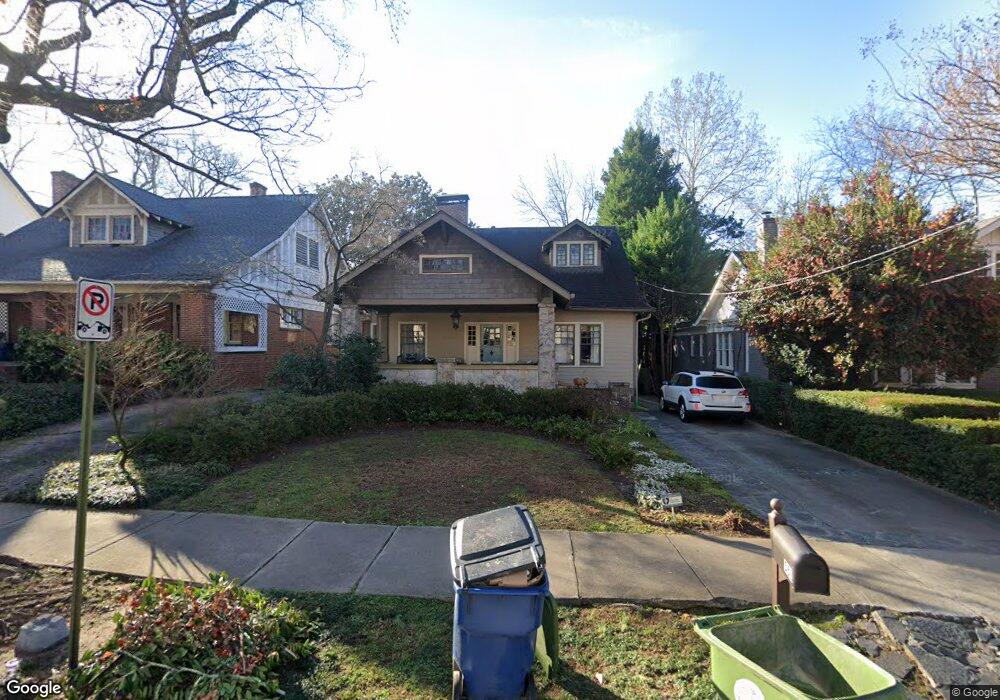
561 Park Dr NE Atlanta, GA 30306
Virginia Highland NeighborhoodEstimated Value: $1,078,000 - $1,753,000
4
Beds
2
Baths
2,004
Sq Ft
$724/Sq Ft
Est. Value
About This Home
This home is located at 561 Park Dr NE, Atlanta, GA 30306 and is currently estimated at $1,451,167, approximately $724 per square foot. 561 Park Dr NE is a home located in Fulton County with nearby schools including Midtown High School, Kindezi Old 4th Ward, and Heritage Preparatory Academy.
Ownership History
Date
Name
Owned For
Owner Type
Purchase Details
Closed on
Aug 17, 2017
Sold by
Few Joseph Mason
Bought by
Wetherington Matthew and Wetherington Michele
Current Estimated Value
Home Financials for this Owner
Home Financials are based on the most recent Mortgage that was taken out on this home.
Original Mortgage
$597,000
Outstanding Balance
$498,150
Interest Rate
3.96%
Mortgage Type
New Conventional
Estimated Equity
$953,017
Purchase Details
Closed on
Dec 4, 2009
Sold by
Kilpatrick Stephen A
Bought by
Few Joseph M and Few Pronda H
Home Financials for this Owner
Home Financials are based on the most recent Mortgage that was taken out on this home.
Original Mortgage
$413,000
Interest Rate
5.38%
Mortgage Type
New Conventional
Purchase Details
Closed on
Mar 1, 2007
Sold by
Woods Millard V
Bought by
Kilpatrick Stephen A
Home Financials for this Owner
Home Financials are based on the most recent Mortgage that was taken out on this home.
Original Mortgage
$531,000
Interest Rate
6.3%
Mortgage Type
New Conventional
Create a Home Valuation Report for This Property
The Home Valuation Report is an in-depth analysis detailing your home's value as well as a comparison with similar homes in the area
Home Values in the Area
Average Home Value in this Area
Purchase History
| Date | Buyer | Sale Price | Title Company |
|---|---|---|---|
| Wetherington Matthew | $796,000 | -- | |
| Few Joseph M | $450,000 | -- | |
| Kilpatrick Stephen A | $590,000 | -- |
Source: Public Records
Mortgage History
| Date | Status | Borrower | Loan Amount |
|---|---|---|---|
| Open | Wetherington Matthew | $597,000 | |
| Previous Owner | Few Joseph M | $413,000 | |
| Previous Owner | Kilpatrick Stephen A | $531,000 |
Source: Public Records
Tax History Compared to Growth
Tax History
| Year | Tax Paid | Tax Assessment Tax Assessment Total Assessment is a certain percentage of the fair market value that is determined by local assessors to be the total taxable value of land and additions on the property. | Land | Improvement |
|---|---|---|---|---|
| 2025 | $16,351 | $616,120 | $345,720 | $270,400 |
| 2023 | $22,505 | $543,600 | $345,720 | $197,880 |
| 2022 | $8,883 | $260,000 | $100,400 | $159,600 |
| 2021 | $8,762 | $260,000 | $100,400 | $159,600 |
| 2020 | $7,941 | $273,440 | $100,400 | $173,040 |
| 2019 | $485 | $255,000 | $85,880 | $169,120 |
| 2018 | $8,726 | $241,880 | $103,160 | $138,720 |
| 2017 | $8,722 | $231,200 | $53,840 | $177,360 |
| 2016 | $8,714 | $231,200 | $53,840 | $177,360 |
| 2015 | $9,205 | $231,200 | $53,840 | $177,360 |
| 2014 | $8,329 | $212,600 | $38,480 | $174,120 |
Source: Public Records
Map
Nearby Homes
- 547 Elmwood Dr NE
- 555 Orme Cir NE
- 1095 Monroe Dr NE
- 1175 Monroe Dr NE
- 1310 Monroe Dr NE
- 587 Virginia Ave NE Unit 805
- 587 Virginia Ave NE Unit 315
- 777 Brookridge Dr NE
- 911 Monroe Cir NE
- 817 Highland Terrace NE
- 560 Dutch Valley Rd NE Unit 2301
- 560 Dutch Valley Rd NE Unit 2403
- 560 Dutch Valley Rd NE Unit 2313
- 1 S Prado NE Unit 1
- 640 Hillpine Dr NE
- 3 Park Ln NE Unit H
- 1156 Piedmont Ave NE Unit A4
- 1204 Piedmont Ave NE Unit 2
- 567 Park Dr NE
- 557 Park Dr NE
- 571 Park Dr NE
- 571 Park Dr NE Unit 571
- 551 Park Dr NE
- 0 Park Dr NE Unit 7515852
- 0 Park Dr NE Unit 7501616
- 0 Park Dr NE Unit 7487987
- 0 Park Dr NE Unit 8608519
- 0 Park Dr NE Unit 8556754
- 0 Park Dr NE Unit 8333654
- 0 Park Dr NE Unit 8311775
- 0 Park Dr NE Unit 8159713
- 0 Park Dr NE Unit 8152489
- 0 Park Dr NE Unit 7599186
- 0 Park Dr NE Unit 7585715
- 0 Park Dr NE Unit 8620321
- 0 Park Dr NE Unit 8520737
- 0 Park Dr NE Unit 8274721
- 0 Park Dr NE Unit 8244319