Estimated Value: $236,000 - $274,000
3
Beds
2
Baths
1,612
Sq Ft
$155/Sq Ft
Est. Value
About This Home
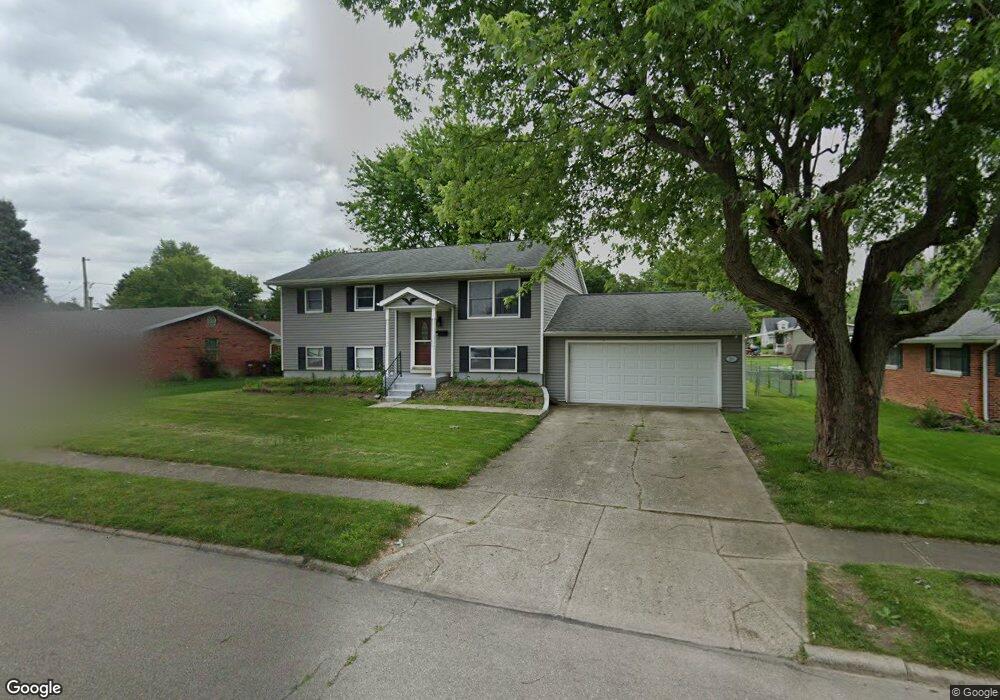
This home is located at 561 Redbud Ln, Xenia, OH 45385 and is currently estimated at $249,207, approximately $154 per square foot. 561 Redbud Ln is a home located in Greene County with nearby schools including Xenia High School, Summit Academy Community School for Alternative Learners - Xenia, and Legacy Christian Academy.
Ownership History
Date
Name
Owned For
Owner Type
Purchase Details
Closed on
Mar 29, 2019
Sold by
Faulkner Virgil L and Faulkner Janice A
Bought by
Garwood Amber L and Reed Jared M
Current Estimated Value
Home Financials for this Owner
Home Financials are based on the most recent Mortgage that was taken out on this home.
Original Mortgage
$150,130
Outstanding Balance
$133,165
Interest Rate
4.75%
Mortgage Type
FHA
Estimated Equity
$116,042
Purchase Details
Closed on
Feb 19, 1997
Sold by
Mash Mark L
Bought by
Faulkner Virgil L and Faulkner A
Home Financials for this Owner
Home Financials are based on the most recent Mortgage that was taken out on this home.
Original Mortgage
$93,350
Interest Rate
7.92%
Mortgage Type
FHA
Create a Home Valuation Report for This Property
The Home Valuation Report is an in-depth analysis detailing your home's value as well as a comparison with similar homes in the area
Home Values in the Area
Average Home Value in this Area
Purchase History
| Date | Buyer | Sale Price | Title Company |
|---|---|---|---|
| Garwood Amber L | $152,900 | None Available | |
| Faulkner Virgil L | $93,500 | -- |
Source: Public Records
Mortgage History
| Date | Status | Borrower | Loan Amount |
|---|---|---|---|
| Open | Garwood Amber L | $150,130 | |
| Closed | Faulkner Virgil L | $93,350 |
Source: Public Records
Tax History Compared to Growth
Tax History
| Year | Tax Paid | Tax Assessment Tax Assessment Total Assessment is a certain percentage of the fair market value that is determined by local assessors to be the total taxable value of land and additions on the property. | Land | Improvement |
|---|---|---|---|---|
| 2024 | $2,703 | $64,830 | $9,100 | $55,730 |
| 2023 | $2,703 | $64,830 | $9,100 | $55,730 |
| 2022 | $2,333 | $47,710 | $5,690 | $42,020 |
| 2021 | $2,365 | $47,710 | $5,690 | $42,020 |
| 2020 | $2,263 | $47,710 | $5,690 | $42,020 |
| 2019 | $2,108 | $40,730 | $6,550 | $34,180 |
| 2018 | $2,116 | $40,730 | $6,550 | $34,180 |
| 2017 | $2,055 | $40,730 | $6,550 | $34,180 |
| 2016 | $1,918 | $36,240 | $6,550 | $29,690 |
| 2015 | $1,924 | $36,240 | $6,550 | $29,690 |
| 2014 | $1,842 | $36,240 | $6,550 | $29,690 |
Source: Public Records
Map
Nearby Homes
- 513 Redbud Ln
- 508 Marshall Dr
- 610 Saxony Dr
- 656 Eden Roc Dr
- 568 Louise Dr
- 479 N Stadium Dr
- 348 S Stadium Dr
- 119 Park Dr
- 659 N King St
- 878 N Detroit St
- 645 E Church St
- 902 N Detroit St
- 1038 Frederick Dr
- 612 E Market St
- 516 N King St
- 1311 Eagles Way
- 1171 N Detroit St
- 137 Pleasant St
- 607 E Main St
- 613 N West St