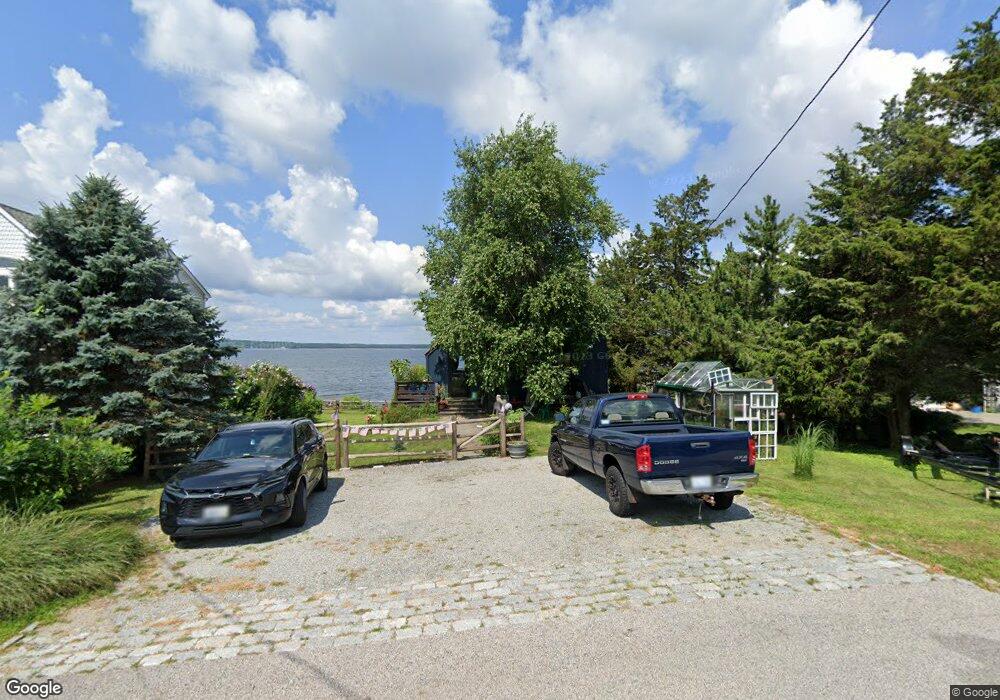
561 Seaside Dr Jamestown, RI 02835
West Reach Estates NeighborhoodEstimated Value: $1,270,000 - $2,142,000
3
Beds
2
Baths
1,483
Sq Ft
$1,075/Sq Ft
Est. Value
About This Home
This home is located at 561 Seaside Dr, Jamestown, RI 02835 and is currently estimated at $1,594,758, approximately $1,075 per square foot. 561 Seaside Dr is a home located in Newport County with nearby schools including Melrose Avenue School and Lawn Avenue School.
Ownership History
Date
Name
Owned For
Owner Type
Purchase Details
Closed on
Feb 26, 2021
Sold by
Hobbs Walter R and Hobbs Stephen J
Bought by
Deresky John J and Deresky Alyssa
Current Estimated Value
Home Financials for this Owner
Home Financials are based on the most recent Mortgage that was taken out on this home.
Original Mortgage
$1,080,000
Outstanding Balance
$968,143
Interest Rate
2.7%
Mortgage Type
VA
Estimated Equity
$626,615
Purchase Details
Closed on
Aug 2, 2016
Sold by
Hobbs Ft
Bought by
Hobbs 4Th Walter R and Hobbs Stephen J
Create a Home Valuation Report for This Property
The Home Valuation Report is an in-depth analysis detailing your home's value as well as a comparison with similar homes in the area
Home Values in the Area
Average Home Value in this Area
Purchase History
| Date | Buyer | Sale Price | Title Company |
|---|---|---|---|
| Deresky John J | $1,200,000 | None Available | |
| Hobbs 4Th Walter R | -- | -- |
Source: Public Records
Mortgage History
| Date | Status | Borrower | Loan Amount |
|---|---|---|---|
| Open | Deresky John J | $1,080,000 |
Source: Public Records
Tax History Compared to Growth
Tax History
| Year | Tax Paid | Tax Assessment Tax Assessment Total Assessment is a certain percentage of the fair market value that is determined by local assessors to be the total taxable value of land and additions on the property. | Land | Improvement |
|---|---|---|---|---|
| 2025 | $8,585 | $1,522,200 | $1,098,400 | $423,800 |
| 2024 | $7,958 | $1,109,900 | $832,100 | $277,800 |
| 2023 | $7,822 | $1,120,700 | $832,100 | $288,600 |
| 2022 | $7,610 | $1,120,700 | $832,100 | $288,600 |
| 2021 | $7,351 | $887,800 | $706,400 | $181,400 |
| 2020 | $7,165 | $887,800 | $706,400 | $181,400 |
| 2019 | $7,147 | $887,800 | $706,400 | $181,400 |
| 2018 | $6,920 | $781,900 | $619,700 | $162,200 |
| 2017 | $6,771 | $781,900 | $619,700 | $162,200 |
| 2016 | $6,709 | $781,900 | $619,700 | $162,200 |
| 2015 | $7,459 | $849,600 | $724,800 | $124,800 |
| 2014 | $7,434 | $849,600 | $724,800 | $124,800 |
Source: Public Records
Map
Nearby Homes
- 398 Sampan Ave
- 280 W Reach Dr
- 86 Spanker St
- 31 Stanchion St
- 58 Dolphin St
- 174 Seaside Dr
- 10 Columbia Ln
- 94 Spindrift St
- 121 Seaside Dr
- 625 N Main Rd
- 18 Collins Terrace
- 50 Prospect Ave
- 21 Helm St
- 12 Easterly Way
- 0 Circuit Ave
- 27 Marcello Dr
- 10 Coulter St
- 10 Highland Rd
- 73 Oceanwoods Dr
- 40 Web Ave Unit 221