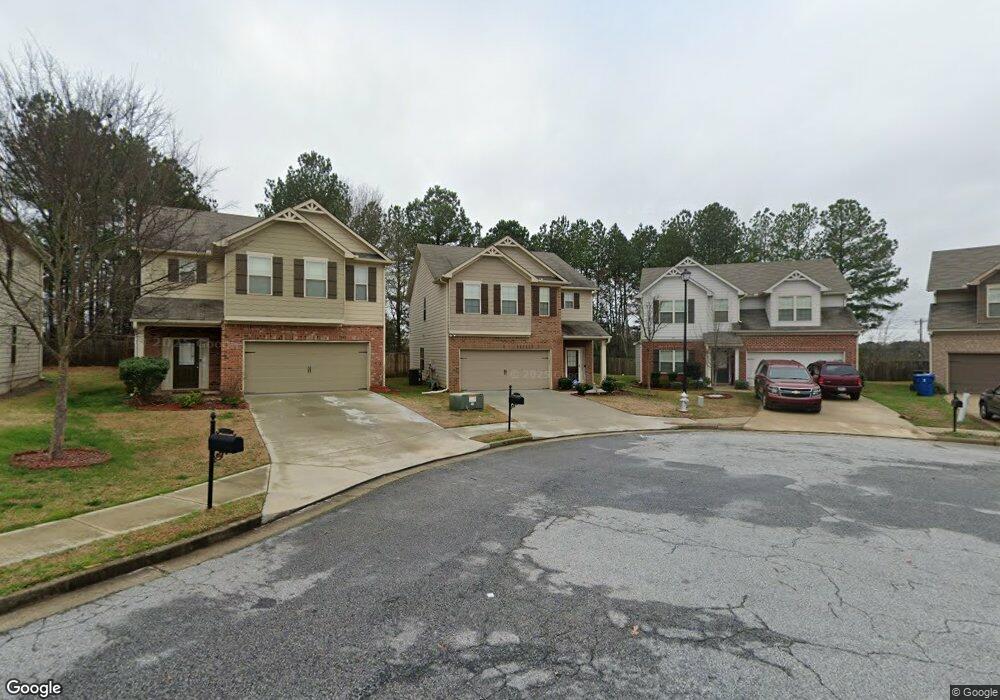
561 Sweet Ashley Way Unit 17 Loganville, GA 30052
Estimated Value: $371,000 - $401,000
4
Beds
3
Baths
2,204
Sq Ft
$174/Sq Ft
Est. Value
About This Home
This home is located at 561 Sweet Ashley Way Unit 17, Loganville, GA 30052 and is currently estimated at $384,250, approximately $174 per square foot. 561 Sweet Ashley Way Unit 17 is a home located in Gwinnett County with nearby schools including Trip Elementary School, Bay Creek Middle School, and Grayson High School.
Ownership History
Date
Name
Owned For
Owner Type
Purchase Details
Closed on
Apr 3, 2019
Sold by
Edwards Yoneil M
Bought by
Edwards Yoneil M and King-Edwards Karen E
Current Estimated Value
Home Financials for this Owner
Home Financials are based on the most recent Mortgage that was taken out on this home.
Original Mortgage
$225,834
Outstanding Balance
$197,818
Interest Rate
4.12%
Mortgage Type
FHA
Estimated Equity
$186,432
Purchase Details
Closed on
Apr 16, 2014
Sold by
Timberglen Properties Llc
Bought by
Jones David E and Jones Crystal T
Home Financials for this Owner
Home Financials are based on the most recent Mortgage that was taken out on this home.
Original Mortgage
$169,000
Interest Rate
4.37%
Mortgage Type
New Conventional
Purchase Details
Closed on
Aug 13, 2013
Sold by
Gwinnett Community Bank
Bought by
Timberglen Properties Llc
Home Financials for this Owner
Home Financials are based on the most recent Mortgage that was taken out on this home.
Original Mortgage
$131,380
Interest Rate
4.39%
Mortgage Type
New Conventional
Create a Home Valuation Report for This Property
The Home Valuation Report is an in-depth analysis detailing your home's value as well as a comparison with similar homes in the area
Home Values in the Area
Average Home Value in this Area
Purchase History
| Date | Buyer | Sale Price | Title Company |
|---|---|---|---|
| Edwards Yoneil M | -- | -- | |
| Edwards Yoneil M | $230,000 | -- | |
| Jones David E | $169,000 | -- | |
| Timberglen Properties Llc | $310,000 | -- |
Source: Public Records
Mortgage History
| Date | Status | Borrower | Loan Amount |
|---|---|---|---|
| Open | Edwards Yoneil M | $225,834 | |
| Closed | Edwards Yoneil M | $225,834 | |
| Previous Owner | Jones David E | $169,000 | |
| Previous Owner | Timberglen Properties Llc | $131,380 |
Source: Public Records
Tax History Compared to Growth
Tax History
| Year | Tax Paid | Tax Assessment Tax Assessment Total Assessment is a certain percentage of the fair market value that is determined by local assessors to be the total taxable value of land and additions on the property. | Land | Improvement |
|---|---|---|---|---|
| 2024 | $4,473 | $149,880 | $30,000 | $119,880 |
| 2023 | $4,473 | $156,120 | $30,400 | $125,720 |
| 2022 | $3,865 | $123,680 | $22,800 | $100,880 |
| 2021 | $3,227 | $90,600 | $17,600 | $73,000 |
| 2020 | $3,247 | $90,600 | $17,600 | $73,000 |
| 2019 | $2,769 | $84,480 | $17,600 | $66,880 |
| 2018 | $2,645 | $78,720 | $17,600 | $61,120 |
| 2016 | $2,471 | $69,720 | $12,000 | $57,720 |
| 2015 | $2,662 | $67,600 | $12,000 | $55,600 |
| 2014 | -- | $69,720 | $12,000 | $57,720 |
Source: Public Records
Map
Nearby Homes
- 3460 Garden Walk Ln
- 474 Cherry Creek Dr
- 504 Bradford Park Ct Unit 6
- 3170 Sparrow Creek Dr
- 520 Aristocrat Dr
- 571 Bradford Place Ct
- 3625 Oak Grove Rd SW
- 3512 Weaver Falls Ln
- 634 Weaver Falls Ct
- 0 Highway 78 Unit 10376768
- 0 Highway 78 Unit 7454844
- 0 Highway 78 Unit 10133175
- 275 Grayson Manor Dr
- 370 Shadowbrooke Dr
- 654 Weaver Falls Ct
- 278 Jarrod Oaks Ct
- 3810 Weeping Willow Ln
- 208 Jarrod Oaks Ct
- 321 Shadowbrooke Dr
- 239 Jarrod Oaks Ct
- 561 Sweet Ashley Way
- 571 Sweet Ashley Way
- 571 Sweet Ashley Way Unit 185130-437
- 551 Sweet Ashley Way Unit 16
- 551 Sweet Ashley Way
- 581 Sweet Ashley Way
- 541 Sweet Ashley Way Unit 15
- 541 Sweet Ashley Way
- 591 Sweet Ashley Way
- 531 Sweet Ashley Way Unit 14
- 531 Sweet Ashley Way
- 521 Sweet Ashley Way
- 601 Sweet Ashley Way
- 601 Sweet Ashley Way
- 601 Sweet Ashley Way
- 528 Sweet Ashley Way Unit 53A
- 528 Sweet Ashley Way
- 501 Sweet Ashley Way
- 501 Sweet Ashley Way Unit 13
- 611 Sweet Ashley Way