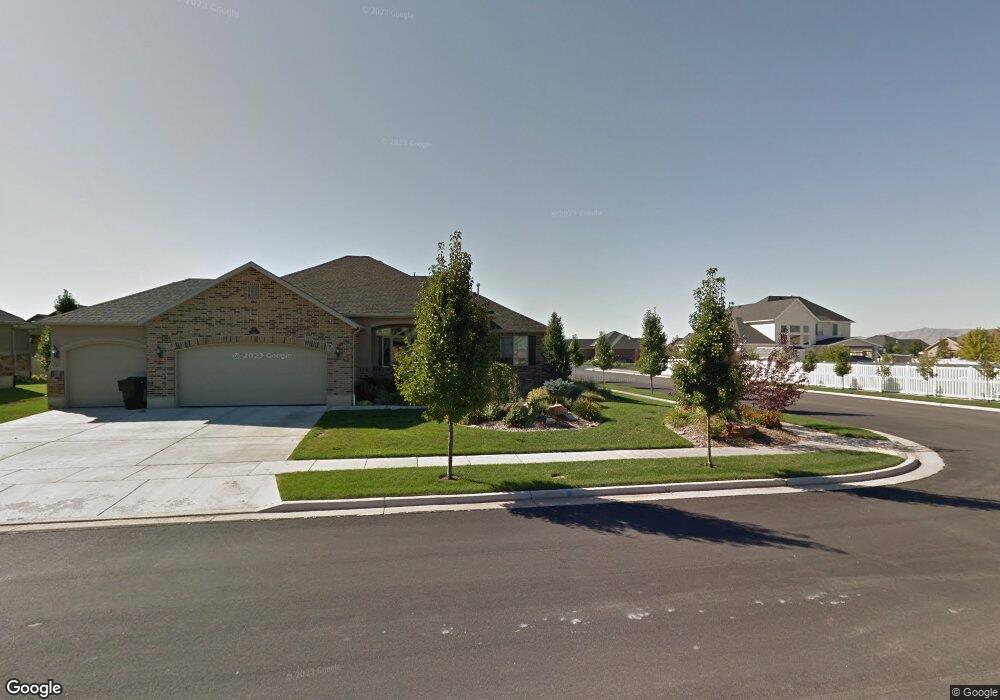
561 W 2810 S Syracuse, UT 84075
Estimated Value: $718,000 - $743,000
6
Beds
4
Baths
3,828
Sq Ft
$192/Sq Ft
Est. Value
About This Home
This home is located at 561 W 2810 S, Syracuse, UT 84075 and is currently estimated at $733,710, approximately $191 per square foot. 561 W 2810 S is a home located in Davis County with nearby schools including Bluff Ridge Elementary, Legacy Junior High School, and Clearfield High School.
Ownership History
Date
Name
Owned For
Owner Type
Purchase Details
Closed on
Mar 26, 2024
Sold by
Berhold Nelson and Berhold Angela
Bought by
Snelgrove Scott C
Current Estimated Value
Home Financials for this Owner
Home Financials are based on the most recent Mortgage that was taken out on this home.
Original Mortgage
$664,050
Outstanding Balance
$653,292
Interest Rate
6.77%
Mortgage Type
New Conventional
Estimated Equity
$80,418
Purchase Details
Closed on
Oct 30, 2020
Sold by
Ferguson Edward E and Ferguson Stacy A
Bought by
Berhold Nelson and Berhold Angela
Home Financials for this Owner
Home Financials are based on the most recent Mortgage that was taken out on this home.
Original Mortgage
$451,920
Interest Rate
2.8%
Mortgage Type
New Conventional
Purchase Details
Closed on
Feb 26, 2018
Sold by
Ferguson Ed and Ferguson Stacy
Bought by
Ferguson Revocable Living Trust
Purchase Details
Closed on
May 22, 2006
Sold by
Destination Homes Inc
Bought by
Morrill Torrey B and Morrill Jill C
Home Financials for this Owner
Home Financials are based on the most recent Mortgage that was taken out on this home.
Original Mortgage
$195,887
Interest Rate
6.46%
Mortgage Type
Fannie Mae Freddie Mac
Purchase Details
Closed on
Nov 7, 2005
Sold by
Discovery Development Llc
Bought by
Destination Homes Inc
Home Financials for this Owner
Home Financials are based on the most recent Mortgage that was taken out on this home.
Original Mortgage
$2,227,500
Interest Rate
5.9%
Mortgage Type
Purchase Money Mortgage
Purchase Details
Closed on
Oct 28, 2005
Sold by
Chournos Lanse
Bought by
Discovery Development Llc
Home Financials for this Owner
Home Financials are based on the most recent Mortgage that was taken out on this home.
Original Mortgage
$2,227,500
Interest Rate
5.9%
Mortgage Type
Purchase Money Mortgage
Create a Home Valuation Report for This Property
The Home Valuation Report is an in-depth analysis detailing your home's value as well as a comparison with similar homes in the area
Home Values in the Area
Average Home Value in this Area
Purchase History
| Date | Buyer | Sale Price | Title Company |
|---|---|---|---|
| Snelgrove Scott C | -- | None Listed On Document | |
| Berhold Nelson | -- | First American Title | |
| Ferguson Revocable Living Trust | -- | -- | |
| Morrill Torrey B | -- | Bonneville Title Company | |
| Destination Homes Inc | -- | Bonneville Title Company | |
| Discovery Development Llc | -- | Founders Title Co |
Source: Public Records
Mortgage History
| Date | Status | Borrower | Loan Amount |
|---|---|---|---|
| Open | Snelgrove Scott C | $664,050 | |
| Previous Owner | Berhold Nelson | $451,920 | |
| Previous Owner | Morrill Torrey B | $195,887 | |
| Previous Owner | Destination Homes Inc | $2,227,500 |
Source: Public Records
Tax History Compared to Growth
Tax History
| Year | Tax Paid | Tax Assessment Tax Assessment Total Assessment is a certain percentage of the fair market value that is determined by local assessors to be the total taxable value of land and additions on the property. | Land | Improvement |
|---|---|---|---|---|
| 2025 | $4,247 | $409,751 | $118,773 | $290,978 |
| 2024 | $3,735 | $386,100 | $98,284 | $287,816 |
| 2023 | $3,735 | $661,000 | $136,944 | $524,056 |
| 2022 | $3,956 | $383,900 | $78,823 | $305,077 |
| 2021 | $3,482 | $523,000 | $116,489 | $406,511 |
| 2020 | $3,115 | $453,000 | $101,450 | $351,550 |
| 2019 | $3,058 | $439,000 | $99,193 | $339,807 |
| 2018 | $2,835 | $404,000 | $95,783 | $308,217 |
| 2016 | $2,617 | $195,580 | $36,762 | $158,818 |
| 2015 | $2,590 | $184,360 | $36,762 | $147,598 |
| 2014 | $2,367 | $171,705 | $36,762 | $134,943 |
| 2013 | -- | $162,755 | $36,655 | $126,100 |
Source: Public Records
Map
Nearby Homes