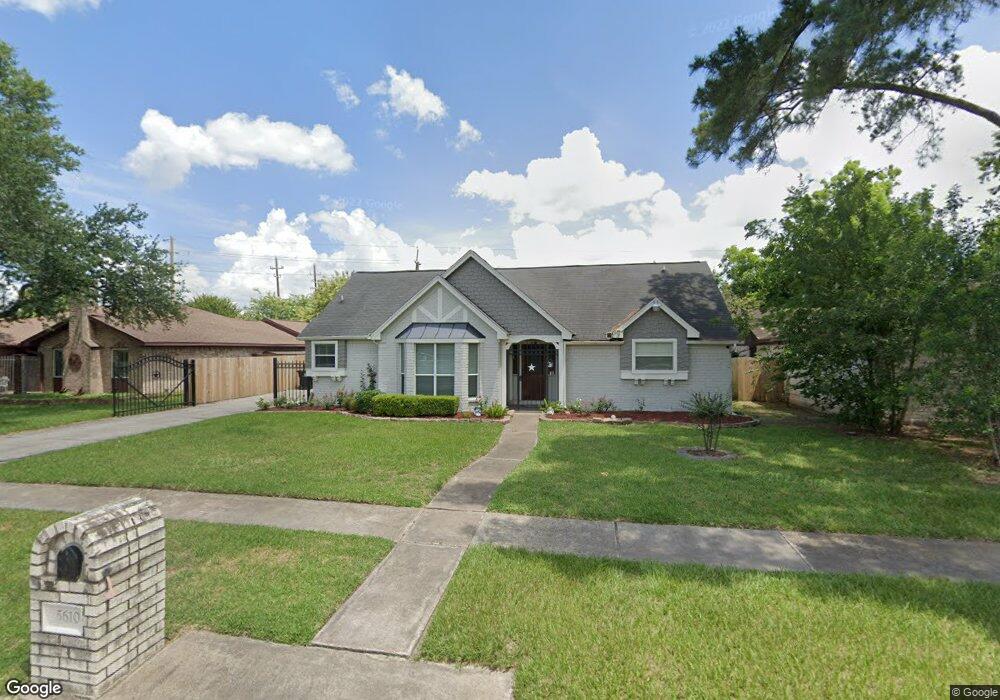
5610 Arncliffe Dr Houston, TX 77088
Greater Inwood NeighborhoodEstimated Value: $215,000 - $245,000
3
Beds
2
Baths
1,948
Sq Ft
$120/Sq Ft
Est. Value
About This Home
This home is located at 5610 Arncliffe Dr, Houston, TX 77088 and is currently estimated at $233,433, approximately $119 per square foot. 5610 Arncliffe Dr is a home located in Harris County with nearby schools including Stovall School, Caraway Intermediate School, and Caraway Elementary School.
Ownership History
Date
Name
Owned For
Owner Type
Purchase Details
Closed on
Sep 28, 2018
Sold by
Macias Daniel
Bought by
Macias Jennifer
Current Estimated Value
Purchase Details
Closed on
Mar 31, 2011
Sold by
Crites Jerry
Bought by
Macias Daniel Laxton and Macias Jennifer
Home Financials for this Owner
Home Financials are based on the most recent Mortgage that was taken out on this home.
Original Mortgage
$85,281
Outstanding Balance
$59,028
Interest Rate
4.87%
Mortgage Type
FHA
Estimated Equity
$174,405
Purchase Details
Closed on
Apr 30, 2007
Sold by
First United Capital Inc
Bought by
Crites Jerry
Home Financials for this Owner
Home Financials are based on the most recent Mortgage that was taken out on this home.
Original Mortgage
$96,000
Interest Rate
9.86%
Mortgage Type
Construction
Purchase Details
Closed on
Sep 6, 2006
Sold by
Mendoza Sylvia M
Bought by
Bank One Na
Create a Home Valuation Report for This Property
The Home Valuation Report is an in-depth analysis detailing your home's value as well as a comparison with similar homes in the area
Home Values in the Area
Average Home Value in this Area
Purchase History
| Date | Buyer | Sale Price | Title Company |
|---|---|---|---|
| Macias Jennifer | -- | None Available | |
| Macias Daniel Laxton | -- | Celebrity Title | |
| Crites Jerry | -- | Fidelity National Title | |
| First United Capital Inc | -- | None Available | |
| Bank One Na | $96,248 | None Available |
Source: Public Records
Mortgage History
| Date | Status | Borrower | Loan Amount |
|---|---|---|---|
| Open | Macias Daniel Laxton | $85,281 | |
| Previous Owner | Crites Jerry | $96,000 |
Source: Public Records
Tax History Compared to Growth
Tax History
| Year | Tax Paid | Tax Assessment Tax Assessment Total Assessment is a certain percentage of the fair market value that is determined by local assessors to be the total taxable value of land and additions on the property. | Land | Improvement |
|---|---|---|---|---|
| 2025 | $3,210 | $208,500 | $49,860 | $158,640 |
| 2024 | $3,210 | $208,500 | $49,860 | $158,640 |
| 2023 | $3,210 | $190,282 | $49,860 | $140,422 |
| 2022 | $4,563 | $226,420 | $49,860 | $176,560 |
| 2021 | $4,344 | $172,951 | $37,395 | $135,556 |
| 2020 | $4,683 | $177,426 | $37,395 | $140,031 |
| 2019 | $4,345 | $157,034 | $19,113 | $137,921 |
| 2018 | $1,758 | $147,403 | $19,113 | $128,290 |
| 2017 | $3,709 | $147,403 | $19,113 | $128,290 |
| 2016 | $3,372 | $137,897 | $19,113 | $118,784 |
| 2015 | $2,331 | $125,923 | $19,113 | $106,810 |
| 2014 | $2,331 | $106,477 | $19,113 | $87,364 |
Source: Public Records
Map
Nearby Homes
- 0 Antoine Dr
- 5519 Council Grove Ln
- 7736 Challie Ln
- 7728 Challie Ln
- 5639 Council Grove Ln
- 7840 Bateman Ln Unit 7840
- 5638 Hickory Forest Dr
- 5606 Water Leaf Ln
- 5514 Long Creek Ln
- 5710 Council Grove Ln
- 7868 Green Lawn Dr Unit 7868
- 7750 Green Lawn Dr
- 6011 Green Falls Dr
- 7727 Green Lawn Dr
- 5914 Lawn Ln
- 5622 Bridge Forest Dr
- 5906 Lawn Ln
- 7526 Antoine Dr
- 8711 Wild Basin Dr
- 4306 Saratoga Dr
- 5606 Arncliffe Dr
- 5614 Arncliffe Dr
- 5602 Arncliffe Dr
- 5618 Arncliffe Dr
- 5611 Arncliffe Dr
- 5611 Arncliffe Dr Unit A
- 5607 Arncliffe Dr
- 5615 Arncliffe Dr
- 5522 Arncliffe Dr
- 5702 Arncliffe Dr
- 5603 Arncliffe Dr
- 5619 Arncliffe Dr
- 5706 Arncliffe Dr
- 5519 Arncliffe Dr
- 5518 Arncliffe Dr
- 5703 Arncliffe Dr
- 5515 Arncliffe Dr
- 5514 Arncliffe Dr
- 5710 Arncliffe Dr
- 5707 Arncliffe Dr