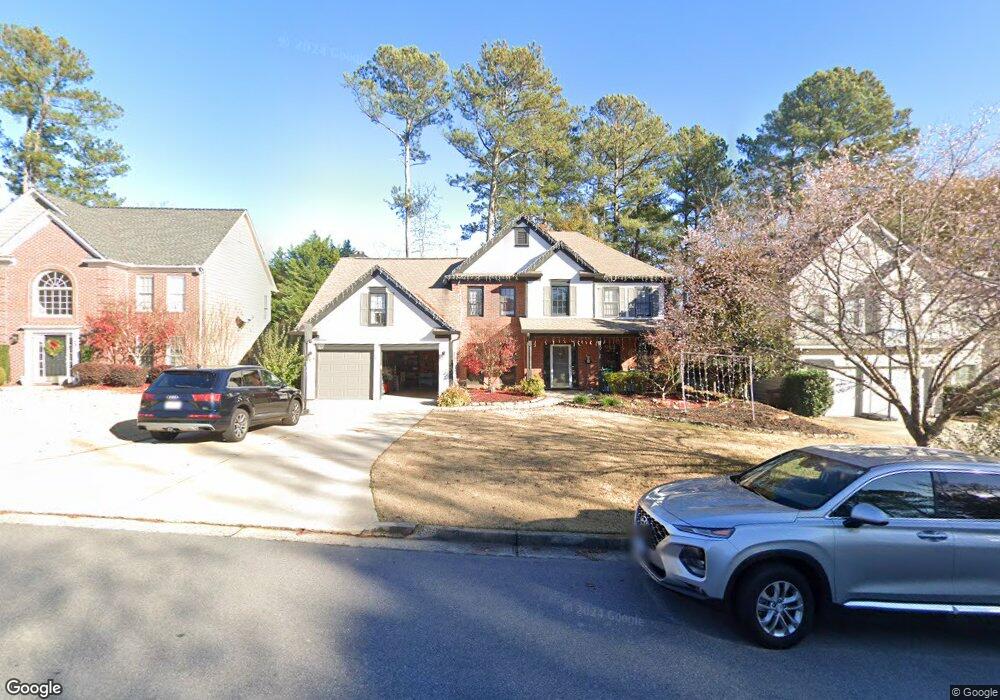
5610 Hillgate Crossing Alpharetta, GA 30005
Estimated Value: $651,000 - $717,000
5
Beds
3
Baths
2,624
Sq Ft
$257/Sq Ft
Est. Value
About This Home
This home is located at 5610 Hillgate Crossing, Alpharetta, GA 30005 and is currently estimated at $675,620, approximately $257 per square foot. 5610 Hillgate Crossing is a home located in Fulton County with nearby schools including Abbotts Hill Elementary School, Taylor Road Middle School, and Chattahoochee High School.
Ownership History
Date
Name
Owned For
Owner Type
Purchase Details
Closed on
Jun 10, 2011
Sold by
Wexler Ronald H and Wexler Lori A
Bought by
Sarangi Chinmaya and Sarangi Heather
Current Estimated Value
Home Financials for this Owner
Home Financials are based on the most recent Mortgage that was taken out on this home.
Original Mortgage
$238,789
Outstanding Balance
$163,608
Interest Rate
4.5%
Mortgage Type
FHA
Estimated Equity
$512,012
Purchase Details
Closed on
Jun 18, 1994
Sold by
Nataro Frank D Susan K
Bought by
Wexler Ronald H Lori A
Home Financials for this Owner
Home Financials are based on the most recent Mortgage that was taken out on this home.
Original Mortgage
$164,150
Interest Rate
8.39%
Create a Home Valuation Report for This Property
The Home Valuation Report is an in-depth analysis detailing your home's value as well as a comparison with similar homes in the area
Home Values in the Area
Average Home Value in this Area
Purchase History
| Date | Buyer | Sale Price | Title Company |
|---|---|---|---|
| Sarangi Chinmaya | $245,000 | -- | |
| Wexler Ronald H Lori A | $172,800 | -- |
Source: Public Records
Mortgage History
| Date | Status | Borrower | Loan Amount |
|---|---|---|---|
| Open | Sarangi Chinmaya | $238,789 | |
| Previous Owner | Wexler Ronald H Lori A | $164,150 |
Source: Public Records
Tax History Compared to Growth
Tax History
| Year | Tax Paid | Tax Assessment Tax Assessment Total Assessment is a certain percentage of the fair market value that is determined by local assessors to be the total taxable value of land and additions on the property. | Land | Improvement |
|---|---|---|---|---|
| 2025 | $3,580 | $204,000 | $43,680 | $160,320 |
| 2023 | $6,259 | $221,760 | $43,680 | $178,080 |
| 2022 | $3,438 | $187,280 | $40,360 | $146,920 |
| 2021 | $3,390 | $144,200 | $35,200 | $109,000 |
| 2020 | $3,412 | $136,600 | $28,680 | $107,920 |
| 2019 | $399 | $134,200 | $28,200 | $106,000 |
| 2018 | $3,751 | $131,040 | $27,520 | $103,520 |
| 2017 | $3,262 | $108,000 | $29,200 | $78,800 |
| 2016 | $3,207 | $108,000 | $29,200 | $78,800 |
| 2015 | $3,458 | $115,680 | $29,200 | $86,480 |
| 2014 | $2,838 | $93,520 | $23,600 | $69,920 |
Source: Public Records
Map
Nearby Homes
- 1660 Gladewood Dr
- 5610 N Hillbrooke Trace
- 11615 Windbrooke Way
- 335 Dunhill Way Ct
- 5575 Ashwind Trace
- 775 Ellsborough Ct
- 100 Windview Place
- 11260 Donnington Dr
- 425 Serrant Ct
- 5785 Oxborough Way Unit 1
- 6365 Murets Rd
- 11505 Bentham Ct
- 5680 Abbotts Bridge Rd
- 640 Arncliffe Ct Unit 1
- 11255 Knollwood Bend
- 5690 Abbotts Bridge Rd
- 11235 Surrey Park Trail
- 5620 Hillgate Crossing Unit 3
- 5600 Hillgate Crossing
- 365 Bristle Stone Ln
- 5630 Hillgate Crossing
- 355 Bristle Stone Ln
- 5590 Hillgate Crossing
- 355 Bristol Stone Ln
- 5575 Hillgate Crossing
- 0 Hilgate
- 375 Bristle Stone Ln
- 345 Bristle Stone Ln
- 5640 Hillgate Crossing
- 5585 Hillgate Crossing
- 375 Bristol Stone Ln
- 1600 Gladewood Dr
- 5580 Hillgate Crossing
- 5595 Hillgate Crossing Unit 3
- 335 Bristol Stone Ln
- 335 Bristol Stone Ln
- 335 Bristle Stone Ln