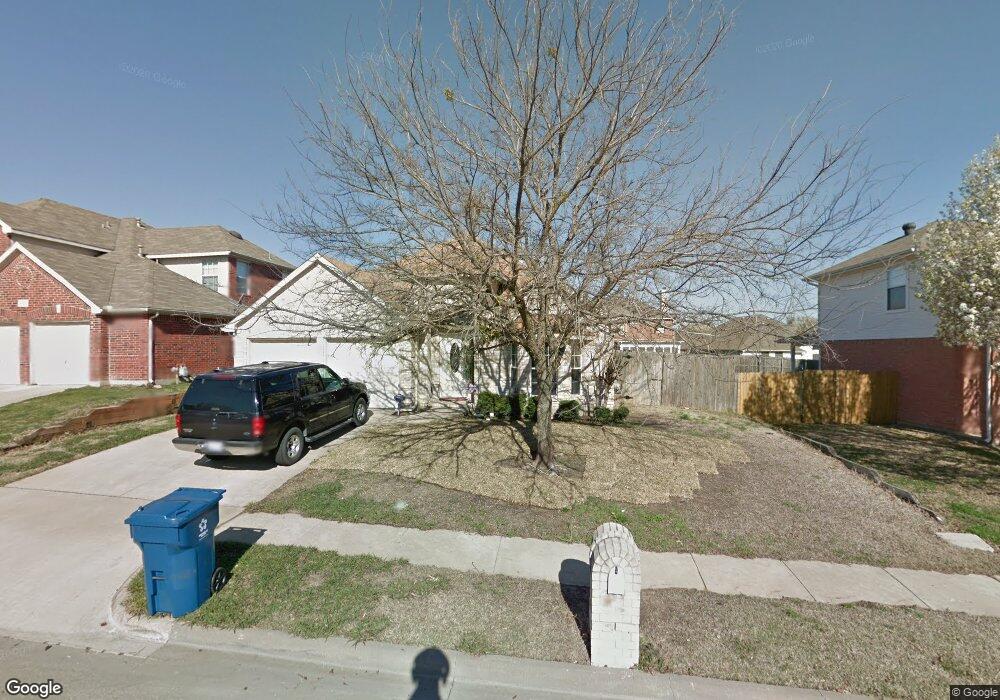
5610 Vista Park Ln Sachse, TX 75048
Estimated Value: $391,832 - $440,000
4
Beds
2
Baths
2,112
Sq Ft
$196/Sq Ft
Est. Value
About This Home
This home is located at 5610 Vista Park Ln, Sachse, TX 75048 and is currently estimated at $414,208, approximately $196 per square foot. 5610 Vista Park Ln is a home located in Collin County with nearby schools including Cheri Cox Elementary School, AB Harrison Intermediate School, and Grady Burnett J High School.
Ownership History
Date
Name
Owned For
Owner Type
Purchase Details
Closed on
Aug 27, 2015
Sold by
Ateman Ronald L and Ateman Arlene
Bought by
Ateman Ronald L and Ateman Arlene
Current Estimated Value
Home Financials for this Owner
Home Financials are based on the most recent Mortgage that was taken out on this home.
Original Mortgage
$163,000
Outstanding Balance
$97,872
Interest Rate
4.08%
Mortgage Type
Credit Line Revolving
Estimated Equity
$316,336
Purchase Details
Closed on
Dec 23, 1998
Sold by
Highland Homes Ltd
Bought by
Ateman Ronald and Carter Arlene
Home Financials for this Owner
Home Financials are based on the most recent Mortgage that was taken out on this home.
Original Mortgage
$134,482
Interest Rate
6.85%
Mortgage Type
FHA
Purchase Details
Closed on
Aug 10, 1998
Sold by
Woodbridge I Ltd
Bought by
Highland Homes Ltd
Home Financials for this Owner
Home Financials are based on the most recent Mortgage that was taken out on this home.
Original Mortgage
$100,912
Interest Rate
6.9%
Create a Home Valuation Report for This Property
The Home Valuation Report is an in-depth analysis detailing your home's value as well as a comparison with similar homes in the area
Home Values in the Area
Average Home Value in this Area
Purchase History
| Date | Buyer | Sale Price | Title Company |
|---|---|---|---|
| Ateman Ronald L | -- | Mortgage Connect Lp | |
| Ateman Ronald | -- | -- | |
| Highland Homes Ltd | -- | -- |
Source: Public Records
Mortgage History
| Date | Status | Borrower | Loan Amount |
|---|---|---|---|
| Open | Ateman Ronald L | $163,000 | |
| Closed | Ateman Ronald | $134,482 | |
| Previous Owner | Highland Homes Ltd | $100,912 |
Source: Public Records
Tax History Compared to Growth
Tax History
| Year | Tax Paid | Tax Assessment Tax Assessment Total Assessment is a certain percentage of the fair market value that is determined by local assessors to be the total taxable value of land and additions on the property. | Land | Improvement |
|---|---|---|---|---|
| 2025 | $6,237 | $396,442 | $100,000 | $306,351 |
| 2024 | $6,237 | $360,402 | $100,000 | $278,496 |
| 2023 | $6,237 | $327,638 | $100,000 | $284,058 |
| 2022 | $6,797 | $297,853 | $80,000 | $282,417 |
| 2021 | $6,525 | $270,775 | $65,000 | $205,775 |
| 2020 | $6,584 | $261,821 | $65,000 | $196,821 |
| 2019 | $6,861 | $261,659 | $55,000 | $206,659 |
| 2018 | $6,454 | $242,707 | $55,000 | $190,044 |
| 2017 | $5,868 | $239,336 | $55,000 | $184,336 |
| 2016 | $5,271 | $215,737 | $45,000 | $170,737 |
| 2015 | $4,157 | $190,851 | $40,000 | $150,851 |
| 2014 | $4,157 | $162,118 | $0 | $0 |
Source: Public Records
Map
Nearby Homes
- 7906 Vista Creek Ln
- 6317 Creekwood Ct
- 7120 Hillshire Ln
- 1721 Paloma Way
- 6209 Creek Crossing Ln
- 6211 Crestmont Ln
- 6521 Hillview Ln
- 5519 Bradford Estates Ct
- 6921 Lakehurst Ln
- 6715 Highland Crest Ln
- 6815 Holly Hills Ln
- 528 Highland Ridge Dr
- 6004 Crestmill Ln
- 6810 Bailey Rd
- 6524 Briar Lake Trail
- 2014 Fairway Woods Dr
- 1905 Fairway Crossing Rd
- 6322 Falcon Crest Ct
- 6106 Lakecrest Dr
- 6325 Timbercrest Trail
- 5608 Vista Park Ln
- 5612 Vista Park Ln
- 5614 Vista Park Ln
- 5606 Vista Park Ln
- 5906 Vista Glen Ln
- 5910 Vista Glen Ln
- 5822 Vista Glen Ln
- 5914 Vista Glen Ln
- 5609 Vista Park Ln
- 5611 Vista Park Ln
- 5704 Vista Park Ln
- 5604 Vista Park Ln
- 5615 Vista Park Ln
- 5715 Vista Park Ln
- 5820 Vista Glen Ln
- 5918 Vista Glen Ln
- 7517 Vista Creek Ln
- 5816 Vista Glen Ln
- 5719 Vista Park Ln
- 5602 Vista Park Ln