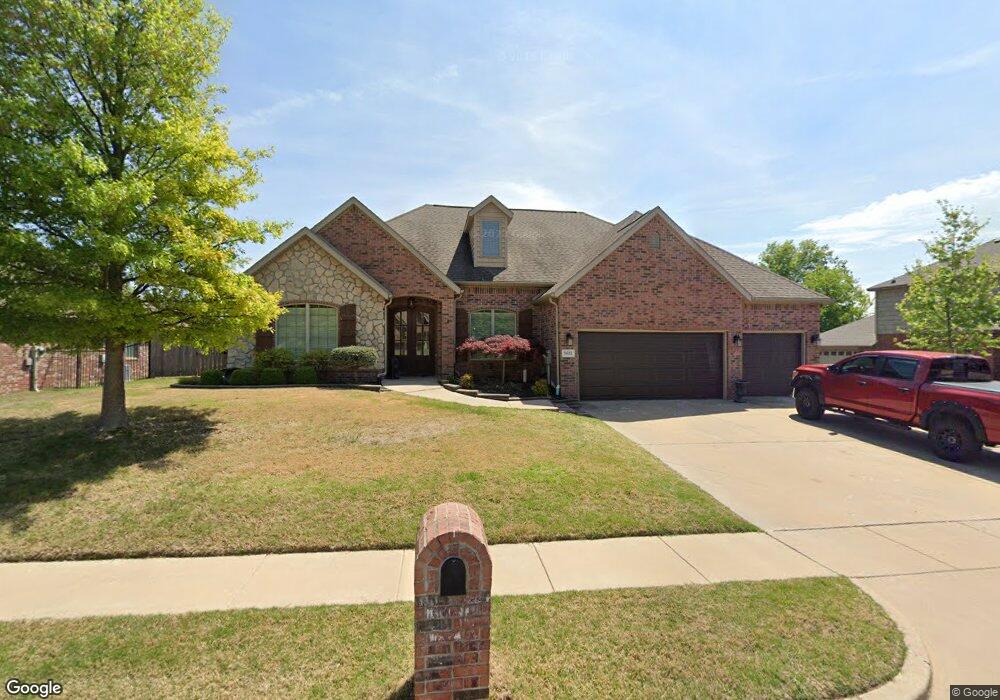
5611 Cooper Ct Bartlesville, OK 74006
Estimated Value: $334,992 - $400,000
3
Beds
3
Baths
2,356
Sq Ft
$154/Sq Ft
Est. Value
About This Home
This home is located at 5611 Cooper Ct, Bartlesville, OK 74006 and is currently estimated at $361,998, approximately $153 per square foot. 5611 Cooper Ct is a home located in Washington County with nearby schools including Wayside Elementary School, Central Middle School, and Bartlesville High School.
Ownership History
Date
Name
Owned For
Owner Type
Purchase Details
Closed on
Dec 9, 2022
Sold by
Miller Philip R and Miller Michelle D
Bought by
Philip Ray Miller And Michelle Dawn Miller Re
Current Estimated Value
Purchase Details
Closed on
May 11, 2022
Sold by
Miller Michelle Dawn and Miller Philip Ray
Bought by
Miller Michelle Dawn and Miller Philip Ray
Purchase Details
Closed on
Apr 12, 2022
Sold by
Miller Michelle Dawn and Miller Philip Ray
Bought by
Miller Michelle Dawn and Miller Philip Ray
Purchase Details
Closed on
Jun 20, 2008
Sold by
Cornerstone Construction Solutions Llc
Bought by
Miller Philip R and Miller Michelle D
Home Financials for this Owner
Home Financials are based on the most recent Mortgage that was taken out on this home.
Original Mortgage
$242,585
Interest Rate
6.05%
Mortgage Type
VA
Create a Home Valuation Report for This Property
The Home Valuation Report is an in-depth analysis detailing your home's value as well as a comparison with similar homes in the area
Home Values in the Area
Average Home Value in this Area
Purchase History
| Date | Buyer | Sale Price | Title Company |
|---|---|---|---|
| Philip Ray Miller And Michelle Dawn Miller Re | -- | -- | |
| Miller Michelle Dawn | -- | None Listed On Document | |
| Miller Michelle Dawn | -- | None Listed On Document | |
| Miller Philip R | $253,500 | None Available |
Source: Public Records
Mortgage History
| Date | Status | Borrower | Loan Amount |
|---|---|---|---|
| Previous Owner | Miller Philip R | $242,585 |
Source: Public Records
Tax History Compared to Growth
Tax History
| Year | Tax Paid | Tax Assessment Tax Assessment Total Assessment is a certain percentage of the fair market value that is determined by local assessors to be the total taxable value of land and additions on the property. | Land | Improvement |
|---|---|---|---|---|
| 2025 | -- | $36,886 | $3,600 | $33,286 |
| 2024 | -- | $35,812 | $4,320 | $31,492 |
| 2023 | $0 | $35,812 | $4,320 | $31,492 |
| 2022 | $0 | $35,812 | $4,320 | $31,492 |
| 2021 | $0 | $35,812 | $4,320 | $31,492 |
| 2020 | $0 | $35,812 | $4,320 | $31,492 |
| 2019 | $4,182 | $35,812 | $4,320 | $31,492 |
| 2018 | $4,058 | $34,948 | $4,320 | $30,628 |
| 2017 | $4,028 | $33,931 | $4,320 | $29,611 |
| 2016 | $3,667 | $32,942 | $4,320 | $28,622 |
| 2015 | $3,724 | $32,942 | $4,320 | $28,622 |
| 2014 | $3,627 | $32,222 | $4,320 | $27,902 |
Source: Public Records
Map
Nearby Homes
- 5711 Nottingham Place
- 5710 Nottingham Place
- 5526 Nottingham Place
- 5514 Ashbrook Dr
- 5300 Charleston Dr
- 2112 SE Lester
- 5205 Charleston Dr
- 5301 Barnett Ave
- 1920 Richmond Dr
- 5205 Barnett Ave
- 2104 SE Lester
- 1 Barnett Ave
- 2 Barnett Ave
- 1912 Lester Ave
- 4105 Starboard Ct
- 4821 SE Barlow Dr
- 1935 Putnam Dr
- 5239 Nowata Rd Unit H102
- 1800 Harned Dr
- 5229 Nowata Rd Unit F101
- 5607 Cooper Ct
- 5610 Cooper Ct
- 5619 Cooper Ct
- 5606 Cooper Ct
- 5603 Cooper Ct
- 5614 Cooper Ct
- 5602 Cooper Ct
- 5618 Cooper Ct
- 5601 Cooper Ct
- 5623 Cooper Ct
- 5611 Nottingham Place
- 5607 Nottingham Place
- 5615 Nottingham Place
- 5622 Cooper Ct
- 5607 Nottingham Place
- 5619 Nottingham Place
- 5627 Cooper Ct
- 5603 Nottingham Dr
- 5626 Cooper Ct
- 5623 Nottingham Place