Estimated Value: $245,000 - $266,000
3
Beds
2
Baths
1,712
Sq Ft
$147/Sq Ft
Est. Value
About This Home
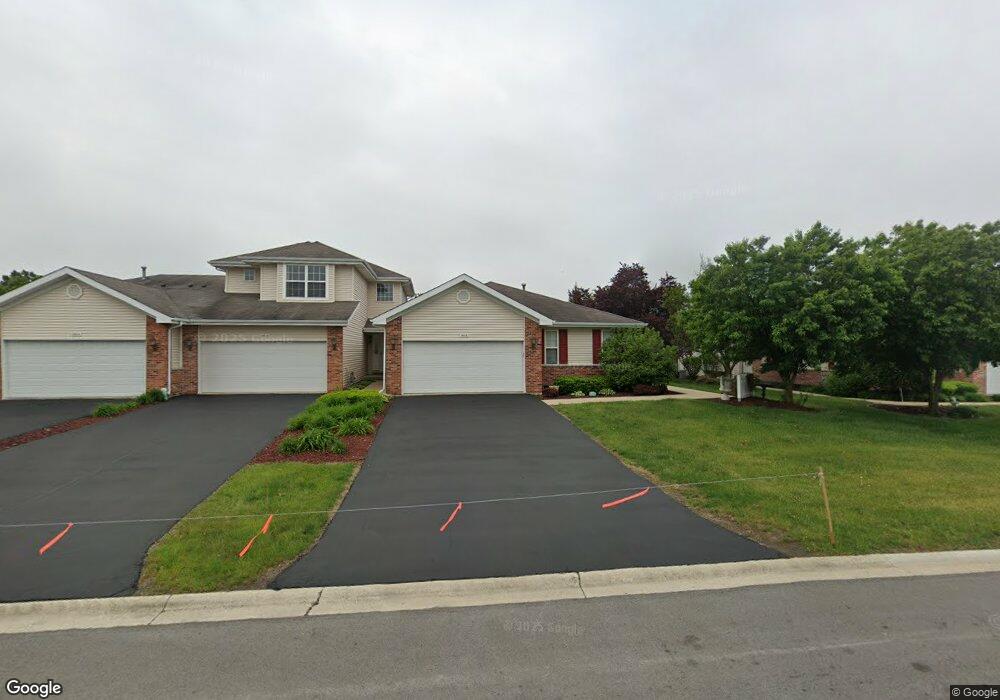
This home is located at 5611 W Sutton Place Unit B, Monee, IL 60449 and is currently estimated at $250,831, approximately $146 per square foot. 5611 W Sutton Place Unit B is a home located in Will County with nearby schools including Monee Elementary School, Crete-Monee Middle School, and Crete-Monee High School.
Ownership History
Date
Name
Owned For
Owner Type
Purchase Details
Closed on
Apr 25, 2019
Sold by
Marassa Kelly A
Bought by
Horton Gwendolyn L
Current Estimated Value
Home Financials for this Owner
Home Financials are based on the most recent Mortgage that was taken out on this home.
Original Mortgage
$159,556
Outstanding Balance
$140,840
Interest Rate
4.5%
Mortgage Type
FHA
Estimated Equity
$109,991
Purchase Details
Closed on
Oct 4, 2018
Sold by
Marassa Kelly A
Bought by
Marassa Kelly A and Kelly A Marassa 2018 Trust
Purchase Details
Closed on
Apr 20, 2006
Sold by
Endor Inc
Bought by
Marassa Kelly A
Home Financials for this Owner
Home Financials are based on the most recent Mortgage that was taken out on this home.
Original Mortgage
$81,000
Interest Rate
6.42%
Mortgage Type
Fannie Mae Freddie Mac
Create a Home Valuation Report for This Property
The Home Valuation Report is an in-depth analysis detailing your home's value as well as a comparison with similar homes in the area
Home Values in the Area
Average Home Value in this Area
Purchase History
| Date | Buyer | Sale Price | Title Company |
|---|---|---|---|
| Horton Gwendolyn L | $162,500 | Old Republic Title | |
| Marassa Kelly A | -- | Attorney | |
| Marassa Kelly A | $181,500 | First American Title Ins Co |
Source: Public Records
Mortgage History
| Date | Status | Borrower | Loan Amount |
|---|---|---|---|
| Open | Horton Gwendolyn L | $159,556 | |
| Previous Owner | Marassa Kelly A | $81,000 |
Source: Public Records
Tax History Compared to Growth
Tax History
| Year | Tax Paid | Tax Assessment Tax Assessment Total Assessment is a certain percentage of the fair market value that is determined by local assessors to be the total taxable value of land and additions on the property. | Land | Improvement |
|---|---|---|---|---|
| 2024 | $6,710 | $80,341 | $5,838 | $74,503 |
| 2023 | $6,710 | $69,260 | $5,033 | $64,227 |
| 2022 | $5,896 | $60,925 | $4,427 | $56,498 |
| 2021 | $5,294 | $55,443 | $4,067 | $51,376 |
| 2020 | $6,107 | $53,646 | $3,935 | $49,711 |
| 2019 | $5,917 | $50,874 | $3,732 | $47,142 |
| 2018 | $5,797 | $49,321 | $3,658 | $45,663 |
| 2017 | $5,670 | $47,385 | $3,529 | $43,856 |
| 2016 | $5,362 | $44,420 | $3,424 | $40,996 |
| 2015 | $4,597 | $40,188 | $3,099 | $37,089 |
| 2014 | $4,597 | $39,633 | $3,056 | $36,577 |
| 2013 | $4,597 | $41,500 | $3,200 | $38,300 |
Source: Public Records
Map
Nearby Homes
- 5601 W Sutton Place Unit A
- 5623 W Von Ave Unit D
- 25830 S Chestnut Rd
- 25927 Derby Dr
- 25821 S Sunrise Ct
- 25836 S Linden Ave
- 25601 S Linden Ave
- 5420 W Main St
- 5421 W Main St
- Lot 4 S Governors Hwy
- 25538 Shinnecock Dr
- 25740 Baltusrol Dr
- 5203 W Court St
- 5406 W Mulberry Ln
- 25604 S Medinah Dr Unit 391
- 5046 W Sawgrass Dr Unit 388
- 5042 W Sawgrass Dr Unit 387
- 25603 S Medinah Dr Unit 330
- 5100 Augusta Blvd Unit 134
- 5155 W Main St
- 5611 W Sutton Place Unit C
- 5611 W Sutton Place Unit A
- 5611 W Sutton Place
- 5613 W Sutton Place Unit C
- 5613 W Sutton Place Unit A
- 5613 W Sutton Place Unit B
- 5609 W Sutton Place Unit B
- 5609 W Sutton Place Unit A
- 5609 W Sutton Place
- 5609 W Sutton Place Unit C
- 5612 W Von Ave Unit B
- 5612 W Von Ave Unit A
- 5612 W Von Ave Unit D
- 5612 W Von Ave Unit C
- 5614 W Von Ave Unit D
- 5614 W Von Ave Unit C
- 5614 W Von Ave Unit B
- 5614 W Von Ave Unit A
- 5612 W Sutton Place Unit B
- 5612 W Sutton Place Unit C