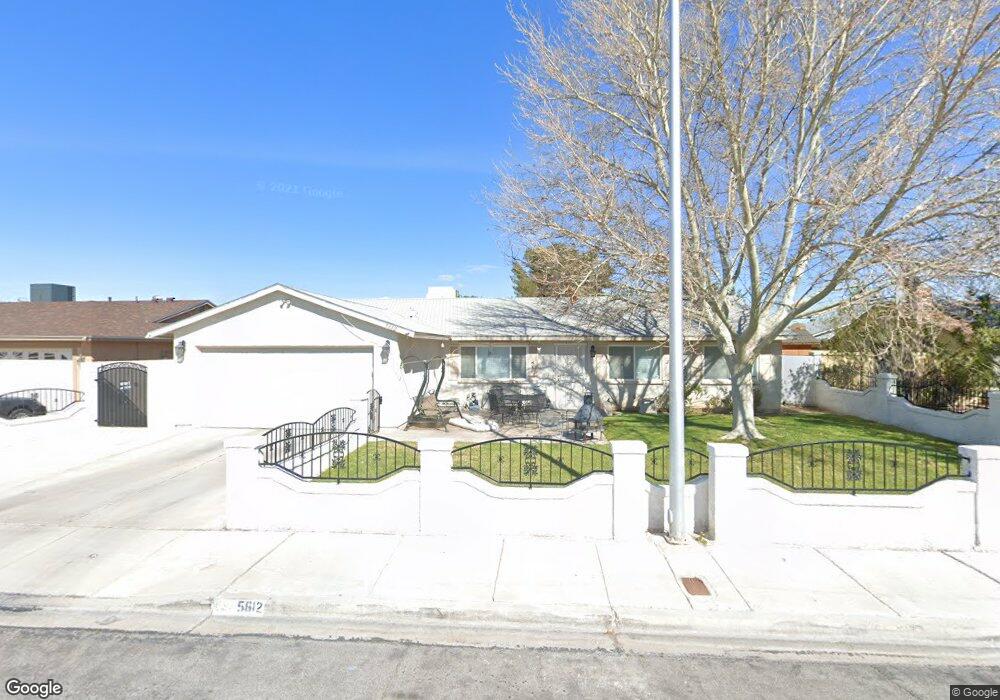
5612 E Monroe Ave Las Vegas, NV 89110
Estimated Value: $423,921 - $443,000
4
Beds
2
Baths
1,760
Sq Ft
$244/Sq Ft
Est. Value
About This Home
This home is located at 5612 E Monroe Ave, Las Vegas, NV 89110 and is currently estimated at $430,230, approximately $244 per square foot. 5612 E Monroe Ave is a home located in Clark County with nearby schools including Stanford Elementary School, Duane D. Keller Middle School, and Eldorado High School.
Ownership History
Date
Name
Owned For
Owner Type
Purchase Details
Closed on
Oct 7, 2020
Sold by
Griffiths Susan and Susan Grifiths Trust
Bought by
Griffiths Susan M
Current Estimated Value
Home Financials for this Owner
Home Financials are based on the most recent Mortgage that was taken out on this home.
Original Mortgage
$177,500
Outstanding Balance
$157,877
Interest Rate
2.9%
Mortgage Type
New Conventional
Estimated Equity
$272,353
Purchase Details
Closed on
Aug 6, 2009
Sold by
Griffiths Susan
Bought by
Griffiths Susan and The Susan Griffiths Trust
Purchase Details
Closed on
Aug 15, 2000
Sold by
Gill Vivian C
Bought by
Griffiths Gary J and Griffiths Susan M
Home Financials for this Owner
Home Financials are based on the most recent Mortgage that was taken out on this home.
Original Mortgage
$134,049
Interest Rate
8.15%
Mortgage Type
FHA
Create a Home Valuation Report for This Property
The Home Valuation Report is an in-depth analysis detailing your home's value as well as a comparison with similar homes in the area
Home Values in the Area
Average Home Value in this Area
Purchase History
| Date | Buyer | Sale Price | Title Company |
|---|---|---|---|
| Griffiths Susan M | -- | Fidelity National Title | |
| Griffiths Susan | -- | None Available | |
| Griffiths Gary J | $134,500 | Fidelity National Title |
Source: Public Records
Mortgage History
| Date | Status | Borrower | Loan Amount |
|---|---|---|---|
| Open | Griffiths Susan M | $177,500 | |
| Previous Owner | Griffiths Gary J | $134,049 |
Source: Public Records
Tax History Compared to Growth
Tax History
| Year | Tax Paid | Tax Assessment Tax Assessment Total Assessment is a certain percentage of the fair market value that is determined by local assessors to be the total taxable value of land and additions on the property. | Land | Improvement |
|---|---|---|---|---|
| 2025 | $1,425 | $73,075 | $29,050 | $44,025 |
| 2024 | $1,384 | $73,075 | $29,050 | $44,025 |
| 2023 | $1,059 | $74,843 | $31,850 | $42,993 |
| 2022 | $1,409 | $64,937 | $24,850 | $40,087 |
| 2021 | $1,365 | $61,700 | $23,100 | $38,600 |
| 2020 | $1,264 | $59,802 | $21,000 | $38,802 |
| 2019 | $1,185 | $56,989 | $18,200 | $38,789 |
| 2018 | $1,131 | $53,878 | $16,100 | $37,778 |
| 2017 | $1,567 | $53,440 | $14,700 | $38,740 |
| 2016 | $1,059 | $48,404 | $8,750 | $39,654 |
| 2015 | $1,056 | $43,049 | $7,000 | $36,049 |
| 2014 | $1,023 | $34,551 | $7,000 | $27,551 |
Source: Public Records
Map
Nearby Homes
- 5754 Cinnabar Ave
- 5772 Cinnabar Ave
- 1345 Stokes St
- 5801 Sunny Orchard Ln
- 5843 Dew Mist Ln
- 4541 E Owens Ave
- 1667 Rockwell Ln
- 5383 E Washington Ave
- 5802 Queenstown Way
- 1491 Sunrise View Dr
- 1831 Castleberry Ln
- 1676 Buck Island St
- 5717 Christchurch Ave
- 5884 Deer Valley Dr
- 1385 Ringe Ln
- 5904 Yucca House Ave
- 5991 Corpus Christi Ct
- 1139 Betty Ln
- 1135 Carefree Peak Ct
- 0 Meikle Ln
- 5626 E Monroe Ave
- 5598 E Monroe Ave
- 5611 Crown Point Ave
- 5599 Crown Point Ave
- 5627 Crown Point Ave
- 5640 E Monroe Ave
- 5584 E Monroe Ave
- 5585 Crown Point Ave
- 5611 E Monroe Ave
- 5625 E Monroe Ave
- 5597 E Monroe Ave
- 5641 Crown Point Ave
- 5583 E Monroe Ave
- 5654 E Monroe Ave
- 5570 E Monroe Ave
- 5571 Crown Point Ave
- 5655 Crown Point Ave
- 1447 Copper Hill Ct
- 5624 Rabbit Springs Rd
- 5610 Rabbit Springs Rd