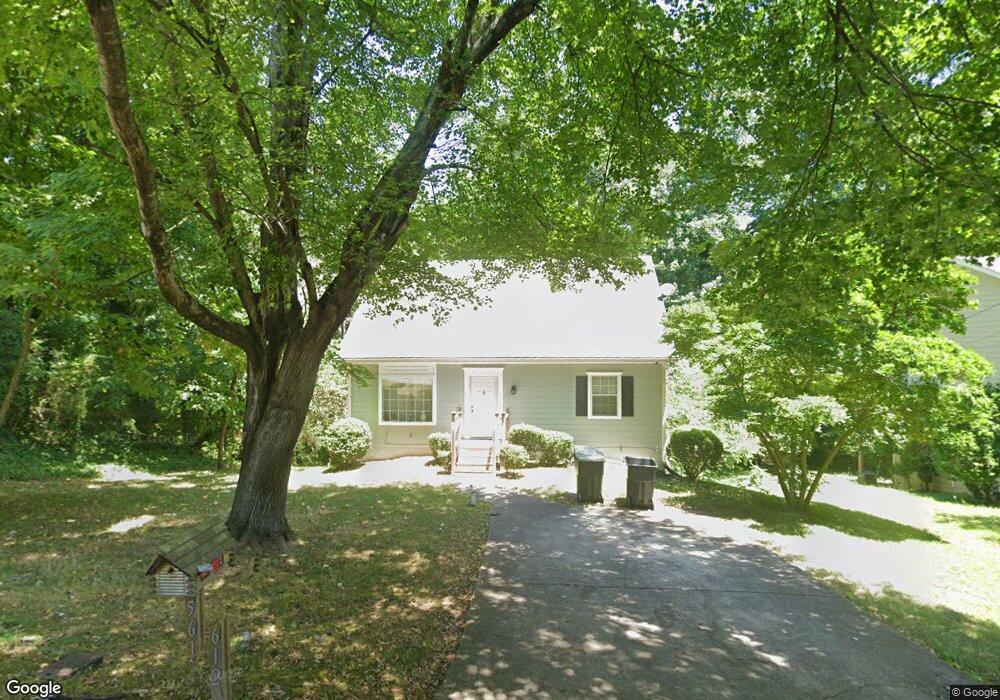
5612 Hammond Dr Unit 7 Norcross, GA 30071
Estimated Value: $299,000 - $329,186
3
Beds
2
Baths
1,282
Sq Ft
$249/Sq Ft
Est. Value
About This Home
This home is located at 5612 Hammond Dr Unit 7, Norcross, GA 30071 and is currently estimated at $319,547, approximately $249 per square foot. 5612 Hammond Dr Unit 7 is a home located in Gwinnett County with nearby schools including Beaver Ridge Elementary School, Summerour Middle School, and Paul Duke STEM High School.
Ownership History
Date
Name
Owned For
Owner Type
Purchase Details
Closed on
Feb 18, 2020
Sold by
Becar Guzman Nelida
Bought by
Ramos Fernando D
Current Estimated Value
Purchase Details
Closed on
Nov 10, 2010
Sold by
Ramos Fernando
Bought by
Ramos Fernando and Guzman Nelida S
Purchase Details
Closed on
Sep 16, 2005
Sold by
Gill Thomas M
Bought by
Ramos Fernando
Home Financials for this Owner
Home Financials are based on the most recent Mortgage that was taken out on this home.
Original Mortgage
$25,200
Interest Rate
5.44%
Mortgage Type
Unknown
Purchase Details
Closed on
Aug 22, 2000
Sold by
Mangum Paula K
Bought by
Gill Thomas M
Purchase Details
Closed on
Mar 31, 1994
Sold by
Buntyn Joan S George M
Bought by
Gill Thomas M and Mangum Paula K
Home Financials for this Owner
Home Financials are based on the most recent Mortgage that was taken out on this home.
Original Mortgage
$72,200
Interest Rate
7.26%
Create a Home Valuation Report for This Property
The Home Valuation Report is an in-depth analysis detailing your home's value as well as a comparison with similar homes in the area
Home Values in the Area
Average Home Value in this Area
Purchase History
| Date | Buyer | Sale Price | Title Company |
|---|---|---|---|
| Ramos Fernando D | -- | -- | |
| Ramos Fernando | -- | -- | |
| Ramos Fernando | $126,000 | -- | |
| Gill Thomas M | -- | -- | |
| Gill Thomas M | $76,000 | -- |
Source: Public Records
Mortgage History
| Date | Status | Borrower | Loan Amount |
|---|---|---|---|
| Previous Owner | Ramos Fernando | $25,200 | |
| Previous Owner | Ramos Fernando | $100,800 | |
| Previous Owner | Gill Thomas M | $72,200 |
Source: Public Records
Tax History Compared to Growth
Tax History
| Year | Tax Paid | Tax Assessment Tax Assessment Total Assessment is a certain percentage of the fair market value that is determined by local assessors to be the total taxable value of land and additions on the property. | Land | Improvement |
|---|---|---|---|---|
| 2025 | $3,058 | $131,960 | $25,840 | $106,120 |
| 2024 | $2,913 | $118,760 | $24,800 | $93,960 |
| 2023 | $2,913 | $118,760 | $24,800 | $93,960 |
| 2022 | $2,690 | $107,440 | $21,600 | $85,840 |
| 2021 | $2,240 | $82,920 | $16,640 | $66,280 |
| 2020 | $1,986 | $70,200 | $14,800 | $55,400 |
| 2019 | $2,618 | $70,200 | $14,800 | $55,400 |
| 2018 | $1,714 | $57,520 | $14,000 | $43,520 |
| 2016 | $1,347 | $46,360 | $10,000 | $36,360 |
| 2015 | $1,163 | $30,760 | $6,000 | $24,760 |
| 2014 | $846 | $30,760 | $6,000 | $24,760 |
Source: Public Records
Map
Nearby Homes
- 5645 Hammond Dr
- 5457 Rails Way
- 5381 Station Cir Unit 3
- 5670 Hollow Ridge Ln
- 2009 Hoot Owl Trail
- 2199 Summertown Dr
- 5341 Goodwick Way
- 5337 Langston Way
- 5477 Windy Creek Ln
- 5479 Windy Creek Ln
- 5375 Goshen Springs Rd
- 91 Brookway Trace
- 2375 Beaver Falls Dr
- 5364 Hickory Knoll
- 5358 Beaver Branch
- 5357 Beaver Branch
- 2848 Wild Laurel Ct
- 2066 Pinnacle Pointe Dr
- 2037 Pinnacle Pointe Dr
- 5639 Chatham Cir
- 5616 Hammond Dr
- 5616 Hammond Dr NW
- 5626 Hammond Dr
- 5605 Hammond Dr
- 5653 Kimberly Ln
- 5615 Hammond Dr
- 5632 Hammond Dr
- 5625 Hammond Dr
- 5663 Kimberly Ln Unit 7
- 5636 Hammond Dr
- 5635 Hammond Dr
- 5664 Kimberly Ln
- 2095 Mitchell Rd Unit 1
- 2115 Mitchell Rd
- 5673 Kimberly Ln
- 2066 Lanier Terrace
- 2105 Mitchell Rd Unit 1
- 5674 Kimberly Ln
- 2085 Mitchell Rd
- 2056 Lanier Terrace Unit 5