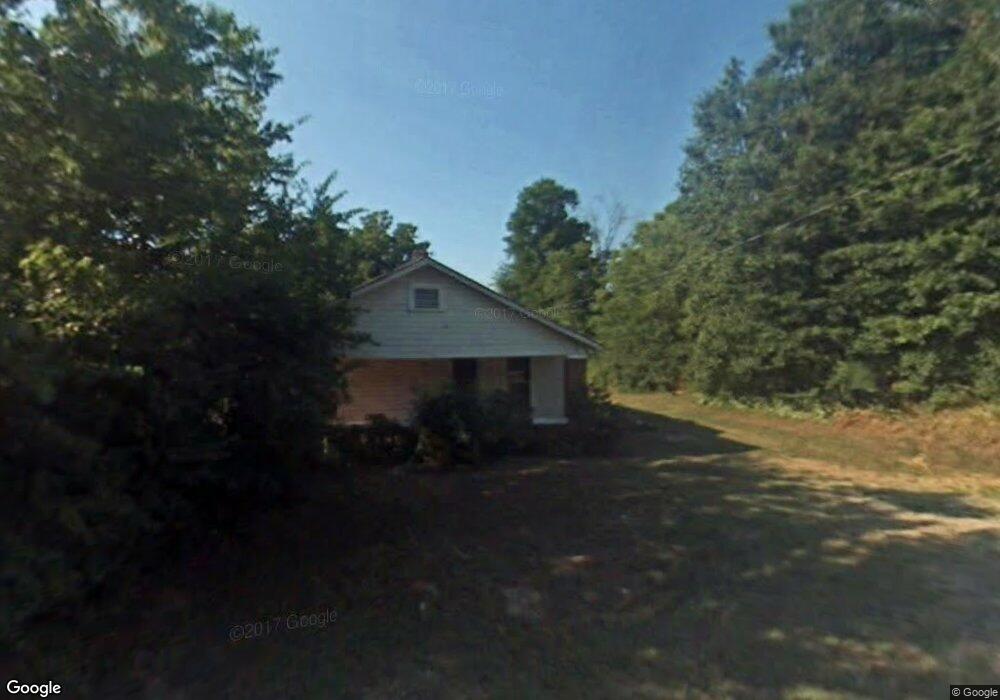
5612 Java Ave Birmingham, AL 35224
Sherman Heights NeighborhoodEstimated Value: $53,451 - $99,000
3
Beds
2
Baths
1,064
Sq Ft
$72/Sq Ft
Est. Value
About This Home
This home is located at 5612 Java Ave, Birmingham, AL 35224 and is currently estimated at $76,113, approximately $71 per square foot. 5612 Java Ave is a home located in Jefferson County with nearby schools including Minor Community School, Minor Middle School, and Minor High School.
Ownership History
Date
Name
Owned For
Owner Type
Purchase Details
Closed on
Aug 26, 2020
Sold by
Ortega Miguel Vilchis
Bought by
Jaimez Juan Barcenas
Current Estimated Value
Purchase Details
Closed on
Sep 6, 2019
Sold by
Southeastern Property Solutions Llc
Bought by
Ortega Miguel Vilchis
Purchase Details
Closed on
Aug 4, 2011
Sold by
Brumley Jimmy and Brumley Pat
Bought by
Brickie Jeremy
Home Financials for this Owner
Home Financials are based on the most recent Mortgage that was taken out on this home.
Original Mortgage
$7,000
Interest Rate
4.52%
Mortgage Type
Seller Take Back
Create a Home Valuation Report for This Property
The Home Valuation Report is an in-depth analysis detailing your home's value as well as a comparison with similar homes in the area
Home Values in the Area
Average Home Value in this Area
Purchase History
| Date | Buyer | Sale Price | Title Company |
|---|---|---|---|
| Jaimez Juan Barcenas | $11,100 | -- | |
| Ortega Miguel Vilchis | $10,500 | -- | |
| Southeastern Property Solutions Llc | $3,500 | -- | |
| Brickie Jeremy | $8,000 | None Available |
Source: Public Records
Mortgage History
| Date | Status | Borrower | Loan Amount |
|---|---|---|---|
| Previous Owner | Brickie Jeremy | $7,000 |
Source: Public Records
Tax History
| Year | Tax Paid | Tax Assessment Tax Assessment Total Assessment is a certain percentage of the fair market value that is determined by local assessors to be the total taxable value of land and additions on the property. | Land | Improvement |
|---|---|---|---|---|
| 2024 | $327 | $6,520 | -- | -- |
| 2022 | $289 | $5,760 | $1,500 | $4,260 |
| 2021 | $111 | $2,220 | $1,500 | $720 |
| 2020 | $111 | $2,220 | $1,500 | $720 |
| 2019 | $111 | $2,220 | $0 | $0 |
| 2018 | $104 | $2,080 | $0 | $0 |
| 2017 | $277 | $5,520 | $0 | $0 |
| 2016 | $277 | $5,520 | $0 | $0 |
| 2015 | $277 | $5,520 | $0 | $0 |
| 2014 | $308 | $5,440 | $0 | $0 |
| 2013 | $308 | $5,440 | $0 | $0 |
Source: Public Records
Map
Nearby Homes
Your Personal Tour Guide
Ask me questions while you tour the home.