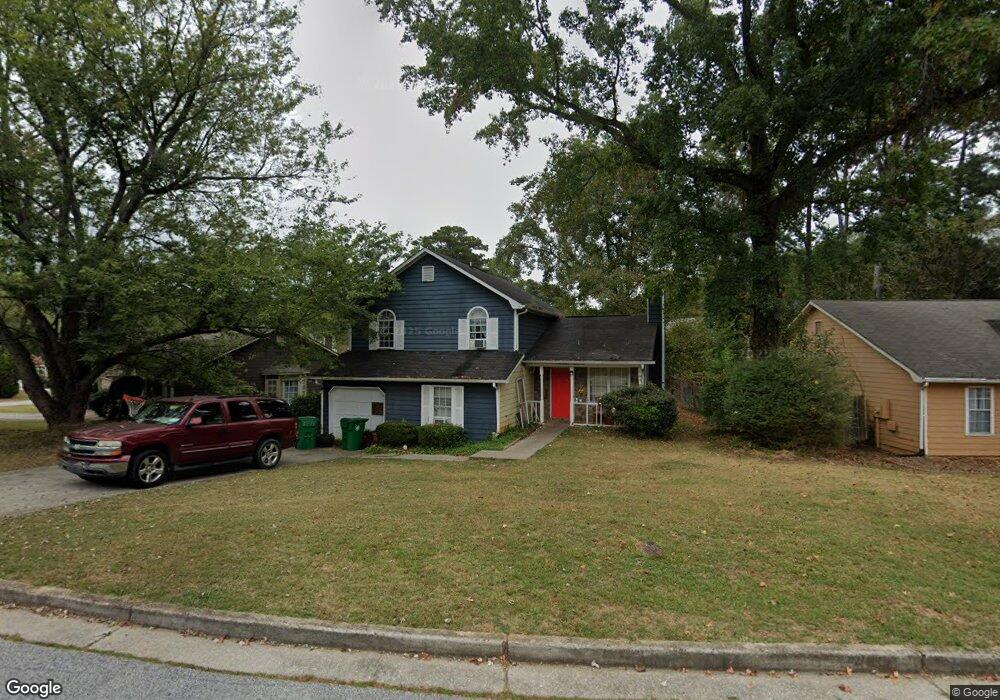
5612 Tunbridge Wells Rd Lithonia, GA 30058
Estimated Value: $225,153 - $252,000
4
Beds
3
Baths
1,617
Sq Ft
$149/Sq Ft
Est. Value
About This Home
This home is located at 5612 Tunbridge Wells Rd, Lithonia, GA 30058 and is currently estimated at $240,788, approximately $148 per square foot. 5612 Tunbridge Wells Rd is a home located in DeKalb County with nearby schools including Redan Elementary School, Redan Middle School, and Redan High School.
Ownership History
Date
Name
Owned For
Owner Type
Purchase Details
Closed on
Feb 7, 2014
Sold by
Turner George
Bought by
Cgp Management & Associates Ll
Current Estimated Value
Purchase Details
Closed on
Dec 30, 2010
Sold by
Home Solutions Ptshp Iii Lp
Bought by
National Title Clearing Div Ll
Purchase Details
Closed on
Nov 4, 2010
Sold by
Home Solutions Partners Iii Lp
Bought by
National Title Clearing Div Ll
Purchase Details
Closed on
Oct 6, 2009
Sold by
Tax Commissioner & Ex Officio
Bought by
Turner George
Purchase Details
Closed on
Aug 31, 2005
Sold by
Hollvey George E
Bought by
Mccullar Paula M
Home Financials for this Owner
Home Financials are based on the most recent Mortgage that was taken out on this home.
Original Mortgage
$144,400
Interest Rate
5.71%
Mortgage Type
New Conventional
Create a Home Valuation Report for This Property
The Home Valuation Report is an in-depth analysis detailing your home's value as well as a comparison with similar homes in the area
Home Values in the Area
Average Home Value in this Area
Purchase History
| Date | Buyer | Sale Price | Title Company |
|---|---|---|---|
| Cgp Management & Associates Ll | -- | -- | |
| National Title Clearing Div Ll | -- | -- | |
| National Title Clearing Div Ll | -- | -- | |
| Turner George | $20,000 | -- | |
| Mccullar Paula M | -- | -- |
Source: Public Records
Mortgage History
| Date | Status | Borrower | Loan Amount |
|---|---|---|---|
| Previous Owner | Mccullar Paula M | $144,400 |
Source: Public Records
Tax History Compared to Growth
Tax History
| Year | Tax Paid | Tax Assessment Tax Assessment Total Assessment is a certain percentage of the fair market value that is determined by local assessors to be the total taxable value of land and additions on the property. | Land | Improvement |
|---|---|---|---|---|
| 2025 | $4,041 | $82,720 | $10,520 | $72,200 |
| 2024 | $3,799 | $77,280 | $10,520 | $66,760 |
| 2023 | $3,799 | $79,600 | $10,520 | $69,080 |
| 2022 | $3,245 | $66,800 | $10,520 | $56,280 |
| 2021 | $2,579 | $51,640 | $5,400 | $46,240 |
| 2020 | $2,044 | $39,440 | $5,400 | $34,040 |
| 2019 | $1,914 | $36,480 | $5,400 | $31,080 |
| 2018 | $1,502 | $34,800 | $3,000 | $31,800 |
| 2017 | $1,324 | $22,920 | $1,960 | $20,960 |
| 2016 | $1,326 | $22,920 | $1,960 | $20,960 |
| 2014 | $1,174 | $19,000 | $1,960 | $17,040 |
Source: Public Records
Map
Nearby Homes
- 1593 Dillard Rd
- 1579 Dillard Rd
- 5601 Tunbridge Wells Rd
- 1598 Dillwood Ct
- 5675 Tunbridge Wells Rd
- 1609 Burnstone Dr
- 5620 Whittondale Rd
- 5577 Whittondale Rd
- 1545 Burnstone Dr
- 5743 Tunbridge Wells Rd
- 1554 Circlestone Dr Unit 1
- 1548 Stoneleigh Way
- 5529 Circlestone Ln
- 1748 Charmeth Rd
- 5598 Emerald Glen
- 1735 Charmeth Rd
- 1509 Burnstone Dr
- 5789 Dorian Ct
- 1437 Stoneleigh Hill Rd
- 1786 Dunbarton Dr
- 5618 Tunbridge Wells Rd
- 5657 Dillwood Crescent
- 5659 Dillwood Crescent
- 5655 Dillwood Crescent
- 5626 Tunbridge Wells Rd
- 5613 Tunbridge Wells Rd
- 5609 Tunbridge Wells Rd
- 5619 Tunbridge Wells Rd
- 5603 Tunbridge Wells Rd
- 5595 Tunbridge Wells Rd
- 5627 Tunbridge Wells Rd
- 5638 Tunbridge Wells Rd
- 5599 Tunbridge Wells Rd Unit 2
- 5591 Tunbridge Wells Rd
- 5582 Tunbridge Wells Rd
- 5656 Dillwood Crescent
- 5585 Tunbridge Wells Rd
- 1583 Dillard Rd
- 1573 Dillard Rd
- 1569 Dillard Rd