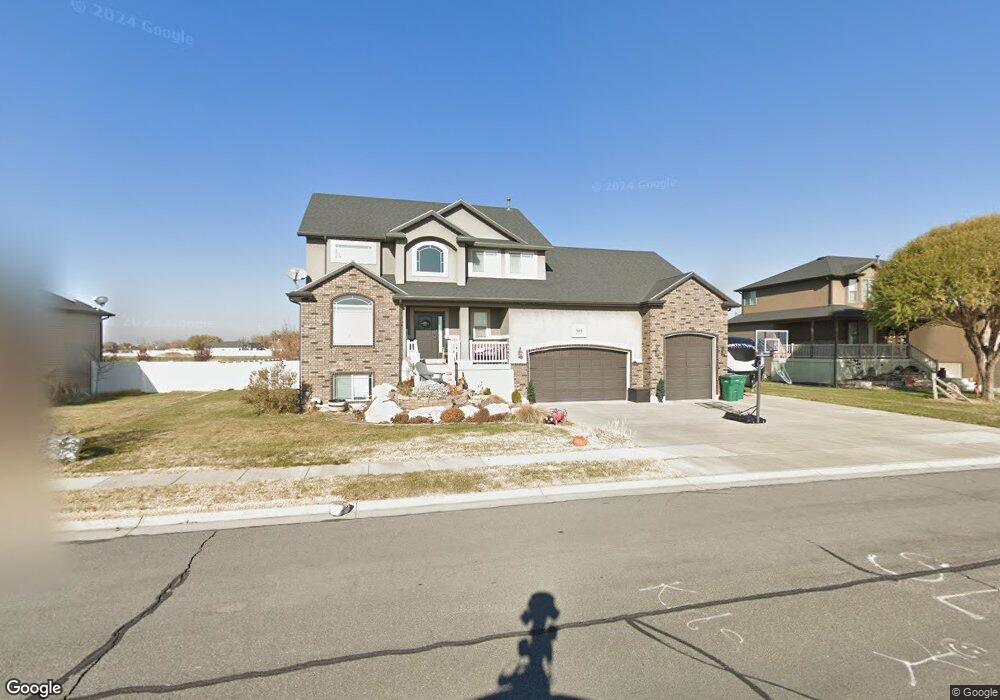
5612 W 5725 S Unit 7 Hooper, UT 84315
Estimated Value: $704,705 - $767,000
4
Beds
3
Baths
2,589
Sq Ft
$282/Sq Ft
Est. Value
About This Home
This home is located at 5612 W 5725 S Unit 7, Hooper, UT 84315 and is currently estimated at $728,926, approximately $281 per square foot. 5612 W 5725 S Unit 7 is a home located in Weber County with nearby schools including Hooper Elementary School, Rocky Mountain Junior High School, and Fremont High School.
Ownership History
Date
Name
Owned For
Owner Type
Purchase Details
Closed on
Feb 20, 2019
Sold by
Wadman Jared D and Wadman Jamie L
Bought by
Lloyd Jared B and Lloyd Julie S
Current Estimated Value
Home Financials for this Owner
Home Financials are based on the most recent Mortgage that was taken out on this home.
Original Mortgage
$348,000
Outstanding Balance
$305,330
Interest Rate
4.4%
Mortgage Type
New Conventional
Estimated Equity
$423,596
Purchase Details
Closed on
Feb 28, 2012
Sold by
Lakeview Farms 1 Llc
Bought by
Wadman Jared D and Wadman Jamie L
Home Financials for this Owner
Home Financials are based on the most recent Mortgage that was taken out on this home.
Original Mortgage
$234,537
Interest Rate
3.83%
Mortgage Type
Construction
Purchase Details
Closed on
Mar 12, 2010
Sold by
Cedar Crest Development Inc
Bought by
Hh21 Llc
Purchase Details
Closed on
Mar 5, 2010
Sold by
Hh21 Llc
Bought by
Lakeview Farms 1 Llc
Create a Home Valuation Report for This Property
The Home Valuation Report is an in-depth analysis detailing your home's value as well as a comparison with similar homes in the area
Home Values in the Area
Average Home Value in this Area
Purchase History
| Date | Buyer | Sale Price | Title Company |
|---|---|---|---|
| Lloyd Jared B | -- | Inwest Title West Haven | |
| Wadman Jared D | -- | Mountain View Title | |
| Hh21 Llc | -- | Cottonwood Title Insurance A | |
| Lakeview Farms 1 Llc | -- | Cottonwood Title Insurance A |
Source: Public Records
Mortgage History
| Date | Status | Borrower | Loan Amount |
|---|---|---|---|
| Open | Lloyd Jared B | $348,000 | |
| Previous Owner | Wadman Jared D | $234,537 |
Source: Public Records
Tax History Compared to Growth
Tax History
| Year | Tax Paid | Tax Assessment Tax Assessment Total Assessment is a certain percentage of the fair market value that is determined by local assessors to be the total taxable value of land and additions on the property. | Land | Improvement |
|---|---|---|---|---|
| 2025 | $3,878 | $676,290 | $220,007 | $456,283 |
| 2024 | $3,734 | $364,649 | $121,003 | $243,646 |
| 2023 | $3,893 | $376,750 | $120,987 | $255,763 |
| 2022 | $3,600 | $356,400 | $93,501 | $262,899 |
| 2021 | $3,170 | $529,000 | $104,975 | $424,025 |
| 2020 | $3,068 | $469,000 | $85,017 | $383,983 |
| 2019 | $2,899 | $419,000 | $79,963 | $339,037 |
| 2018 | $2,930 | $405,000 | $74,991 | $330,009 |
| 2017 | $2,749 | $368,000 | $53,041 | $314,959 |
| 2016 | $2,773 | $200,384 | $28,865 | $171,519 |
| 2015 | $2,699 | $192,216 | $28,865 | $163,351 |
| 2014 | $2,485 | $172,155 | $28,865 | $143,290 |
Source: Public Records
Map
Nearby Homes
- 5335 W 5500 S
- 0 W 5500 S
- 3632 S 5400 W
- 6014 W 5300 S
- 4909 W 5850 S
- 2462 N Hooded Crane Ct
- 2444 N Hooded Crane Cir Unit 11
- 2084 N 4500 W
- 4700 W 5500 S
- 4632 W 5750 S
- 4879 S 5050 W
- 5752 W 2425 N
- 3729 S 5600 W Unit 6
- 3720 S 5600 W Unit 2
- 3719 S 5600 W Unit 7
- 6036 W 4700 S
- Torino Farmhouse Plan at Cranefield Estates
- 1700 Farmhouse Plan at Cranefield Estates - Estates Collection
- 2000 Traditional Plan at Cranefield Estates - Estates Collection
- Murano Traditional Plan at Cranefield Estates - Estates Collection
- 5612 W 5725 S
- 5596 W 5725 S
- 5596 W 5725 S Unit 6
- 5628 W 5725 S
- 5628 W 5725 S Unit 8
- 5625 W 5725 S
- 5625 W 5725 S Unit 18
- 5582 W 5725 S Unit 5
- 5582 W 5725 S
- 5642 W 5725 S
- 5642 W 5725 S Unit 9
- 5589 W 5725 S
- 5589 W 5725 S Unit 20
- 5605 W 5725 S
- 5605 W 5725 S Unit 19
- 5637 W 5725 S
- 5637 W 5725 S Unit 17
- 5564 W 5725 S Unit 4
- 5660 W 5725 S
- 5660 W 5725 S Unit 10