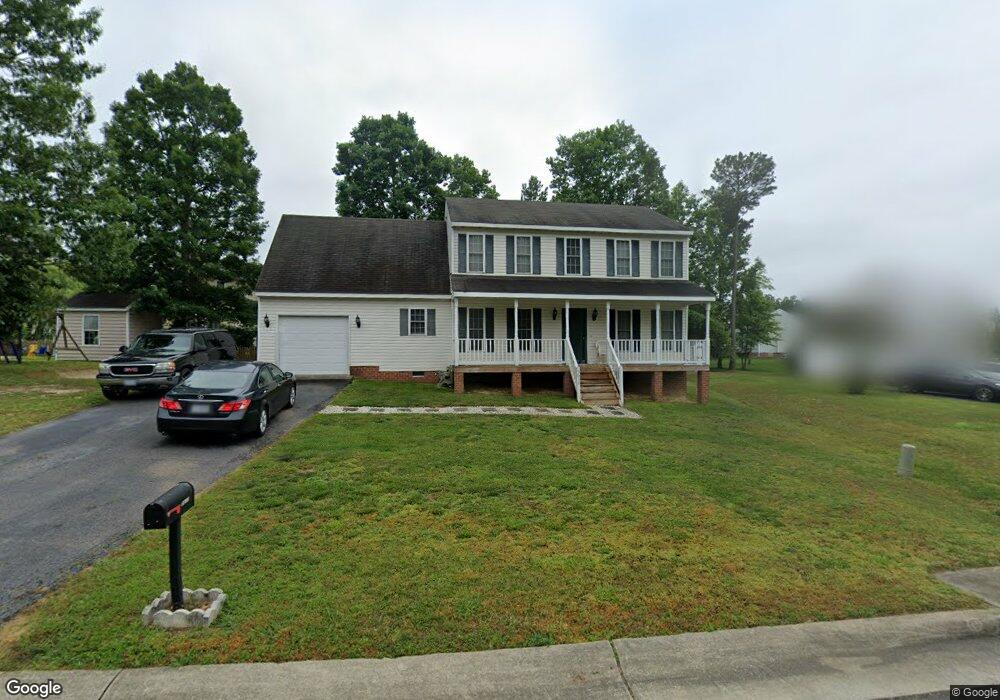
5613 Backwater Dr North Chesterfield, VA 23234
Estimated Value: $385,000 - $404,000
4
Beds
3
Baths
2,062
Sq Ft
$191/Sq Ft
Est. Value
About This Home
This home is located at 5613 Backwater Dr, North Chesterfield, VA 23234 and is currently estimated at $394,072, approximately $191 per square foot. 5613 Backwater Dr is a home located in Chesterfield County with nearby schools including J G Hening Elementary School, Falling Creek Middle, and Meadowbrook High School.
Ownership History
Date
Name
Owned For
Owner Type
Purchase Details
Closed on
Sep 22, 2010
Sold by
Deutsche Bank Trust Co America
Bought by
Goodson Cornelius
Current Estimated Value
Home Financials for this Owner
Home Financials are based on the most recent Mortgage that was taken out on this home.
Original Mortgage
$169,866
Outstanding Balance
$112,168
Interest Rate
4.44%
Mortgage Type
FHA
Estimated Equity
$281,904
Purchase Details
Closed on
May 4, 2010
Sold by
Nectar Projects Inc Sub Tr
Bought by
Deutsche Bank Trust Co America
Purchase Details
Closed on
Apr 12, 2005
Sold by
Classic Homecrafters
Bought by
Bynum Shelton Tomeica
Home Financials for this Owner
Home Financials are based on the most recent Mortgage that was taken out on this home.
Original Mortgage
$179,955
Interest Rate
5.78%
Mortgage Type
New Conventional
Purchase Details
Closed on
Jun 4, 2004
Sold by
Associated Builders Allia
Bought by
Classic Homecrafters Inc
Create a Home Valuation Report for This Property
The Home Valuation Report is an in-depth analysis detailing your home's value as well as a comparison with similar homes in the area
Home Values in the Area
Average Home Value in this Area
Purchase History
| Date | Buyer | Sale Price | Title Company |
|---|---|---|---|
| Goodson Cornelius | $173,000 | -- | |
| Deutsche Bank Trust Co America | $210,000 | -- | |
| Bynum Shelton Tomeica | $199,950 | -- | |
| Classic Homecrafters Inc | $238,000 | -- |
Source: Public Records
Mortgage History
| Date | Status | Borrower | Loan Amount |
|---|---|---|---|
| Open | Goodson Cornelius | $169,866 | |
| Previous Owner | Bynum Shelton Tomeica | $179,955 |
Source: Public Records
Tax History Compared to Growth
Tax History
| Year | Tax Paid | Tax Assessment Tax Assessment Total Assessment is a certain percentage of the fair market value that is determined by local assessors to be the total taxable value of land and additions on the property. | Land | Improvement |
|---|---|---|---|---|
| 2025 | $3,066 | $341,700 | $60,000 | $281,700 |
| 2024 | $3,066 | $337,100 | $60,000 | $277,100 |
| 2023 | $3,026 | $332,500 | $60,000 | $272,500 |
| 2022 | $2,559 | $278,200 | $54,000 | $224,200 |
| 2021 | $2,373 | $242,800 | $52,000 | $190,800 |
| 2020 | $2,159 | $227,300 | $52,000 | $175,300 |
| 2019 | $2,074 | $218,300 | $52,000 | $166,300 |
| 2018 | $2,074 | $218,300 | $52,000 | $166,300 |
| 2017 | $2,037 | $212,200 | $52,000 | $160,200 |
| 2016 | $1,952 | $203,300 | $51,000 | $152,300 |
| 2015 | $1,905 | $195,800 | $50,000 | $145,800 |
| 2014 | $1,905 | $195,800 | $50,000 | $145,800 |
Source: Public Records
Map
Nearby Homes
- 5329 Meadoway Rd
- 5325 Meadoway Rd
- 3429 Jessup Pond Ln
- 3405 Jessup Pond Ln
- 3409 Jessup Pond Ln
- 3417 Jessup Pond Ln
- 3425 Jessup Pond Ln
- 3413 Jessup Pond Ln
- 3421 Jessup Pond Ln
- 6000 Barnwood Dr
- 5942 Jessup Rd
- 5213 W Rock Spring Dr
- 5884 Heathers Crossing Dr
- 5819 Kings Grove Dr
- 5125 Hackney Rd
- 4921 Crispin Ct
- 6218 Howell Dr
- 4903 Waycrest Terrace
- 5206 Hallmark Dr
- 5713 Lakemere Dr
- 5625 Backwater Dr
- 5608 Backwater Terrace
- 5602 Backwater Terrace
- 5614 Backwater Terrace
- 5606 Backwater Dr
- 5637 Backwater Dr
- 5542 Backwater Terrace
- 5620 Backwater Terrace
- 5618 Backwater Dr
- 5612 Backwater Dr
- 5609 Backwater Terrace
- 5624 Backwater Dr
- 5626 Backwater Terrace
- 5643 Backwater Dr
- 5603 Backwater Terrace
- 5536 Backwater Terrace
- 5615 Backwater Terrace
- 5543 Backwater Terrace
- 6806 Ironhorse Ct
- 5630 Backwater Dr