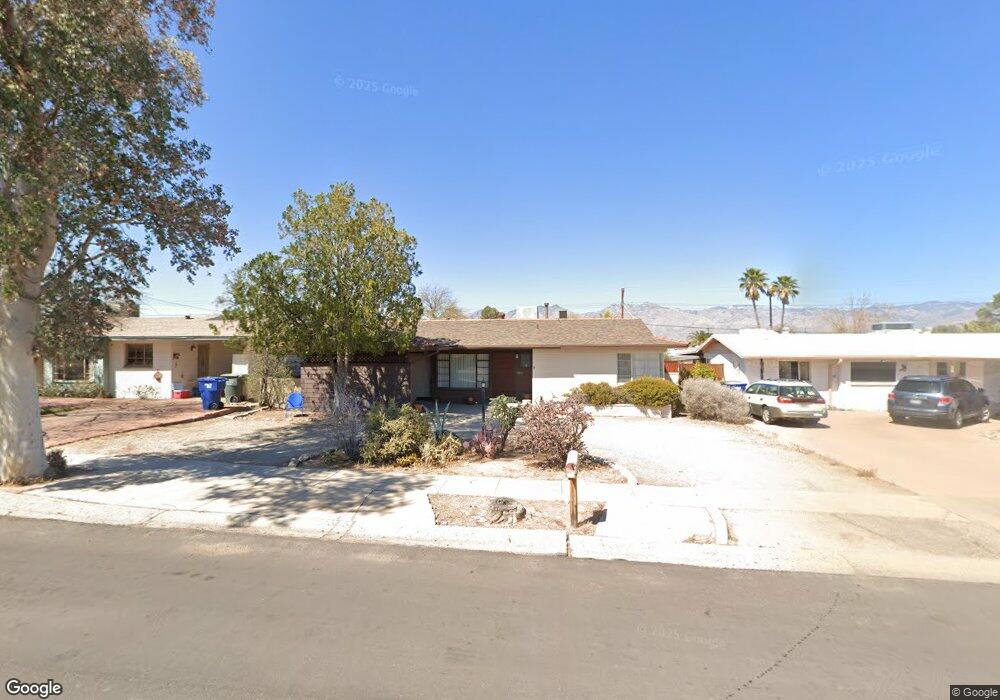
5613 E 3rd St Tucson, AZ 85711
Mitman NeighborhoodEstimated Value: $279,694 - $292,000
Studio
2
Baths
1,125
Sq Ft
$254/Sq Ft
Est. Value
About This Home
This home is located at 5613 E 3rd St, Tucson, AZ 85711 and is currently estimated at $286,174, approximately $254 per square foot. 5613 E 3rd St is a home located in Pima County with nearby schools including W. Arthur Sewell Elementary School, Booth-Fickett Math/Science Magnet School, and Rincon High School.
Ownership History
Date
Name
Owned For
Owner Type
Purchase Details
Closed on
Feb 13, 2006
Sold by
Minnella Kathleen C
Bought by
Nowlan Brenda
Current Estimated Value
Home Financials for this Owner
Home Financials are based on the most recent Mortgage that was taken out on this home.
Original Mortgage
$145,600
Outstanding Balance
$80,079
Interest Rate
6.2%
Mortgage Type
New Conventional
Estimated Equity
$206,095
Purchase Details
Closed on
Sep 29, 1995
Sold by
Spargur Perry M
Bought by
Minnella Kathleen C and Campbell Vernon L
Home Financials for this Owner
Home Financials are based on the most recent Mortgage that was taken out on this home.
Original Mortgage
$80,726
Interest Rate
7.97%
Mortgage Type
FHA
Create a Home Valuation Report for This Property
The Home Valuation Report is an in-depth analysis detailing your home's value as well as a comparison with similar homes in the area
Home Values in the Area
Average Home Value in this Area
Purchase History
| Date | Buyer | Sale Price | Title Company |
|---|---|---|---|
| Nowlan Brenda | $182,000 | None Available | |
| Nowlan Brenda | $182,000 | None Available | |
| Minnella Kathleen C | $81,000 | -- |
Source: Public Records
Mortgage History
| Date | Status | Borrower | Loan Amount |
|---|---|---|---|
| Open | Nowlan Brenda | $145,600 | |
| Closed | Nowlan Brenda | $145,600 | |
| Previous Owner | Minnella Kathleen C | $80,726 |
Source: Public Records
Tax History
| Year | Tax Paid | Tax Assessment Tax Assessment Total Assessment is a certain percentage of the fair market value that is determined by local assessors to be the total taxable value of land and additions on the property. | Land | Improvement |
|---|---|---|---|---|
| 2026 | $1,788 | $16,096 | -- | -- |
| 2025 | $1,788 | $15,329 | -- | -- |
| 2024 | $1,713 | $14,599 | -- | -- |
| 2023 | $1,605 | $13,904 | $0 | $0 |
| 2022 | $1,617 | $13,242 | $0 | $0 |
| 2021 | $1,623 | $12,011 | $0 | $0 |
| 2020 | $1,558 | $12,011 | $0 | $0 |
| 2019 | $1,513 | $12,389 | $0 | $0 |
| 2018 | $1,443 | $10,680 | $0 | $0 |
| 2017 | $1,418 | $10,680 | $0 | $0 |
| 2016 | $1,412 | $10,389 | $0 | $0 |
| 2015 | $1,351 | $9,894 | $0 | $0 |
Source: Public Records
Map
Nearby Homes
- 802 N Jefferson Ave
- 5549 E 2nd St
- 5450 E Hawthorne St
- 5602 E 1st St
- 5801 E Rosewood St
- 5631 E 1st St
- 5819 E Rosewood St
- 5702 E 6th St
- 5457 E 6th St
- 5466 E 6th St
- 5322 E Hawthorne St
- 5312 E Hawthorne St
- 5511 E Helen St
- 5865 E 2nd St
- 5308 E 2nd St
- 5731 E Helen St
- 5926 E Baker St
- 5221 E Hawthorne Place
- 5408 E Willard St
- 5349 E Bellevue St
- 5619 E 3rd St
- 5607 E 3rd St
- 5625 E 3rd St
- 5614 E Rosewood St
- 5620 E Rosewood St
- 5608 E Rosewood St
- 5631 E 3rd St
- 5626 E Rosewood St
- 832 N Jefferson Ave
- 5614 E 3rd St
- 5620 E 3rd St
- 5608 E 3rd St
- 5632 E Rosewood St
- 5626 E 3rd St
- 732 N Jefferson Ave
- 5637 E 3rd St
- 5525 E 3rd St
- 5632 E 3rd St
- 5638 E Rosewood St
- 831 N Jefferson Ave
Your Personal Tour Guide
Ask me questions while you tour the home.