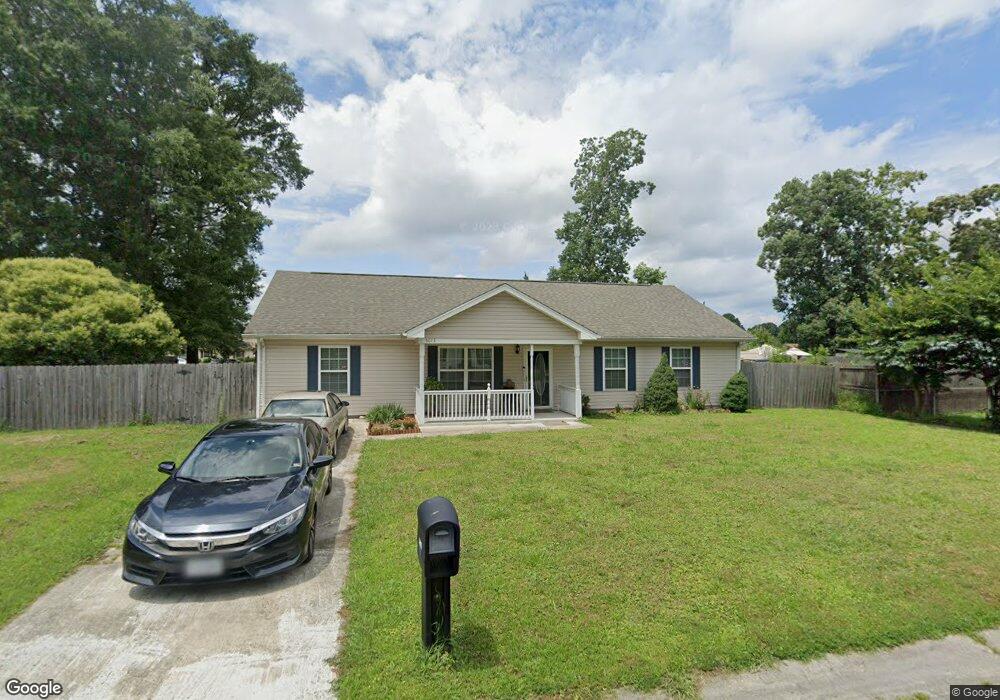
5613 Frank St Suffolk, VA 23435
Nansemond NeighborhoodEstimated Value: $304,000 - $350,000
4
Beds
2
Baths
1,750
Sq Ft
$190/Sq Ft
Est. Value
About This Home
This home is located at 5613 Frank St, Suffolk, VA 23435 and is currently estimated at $332,970, approximately $190 per square foot. 5613 Frank St is a home located in Suffolk City with nearby schools including Creekside Elementary School, John Yeates Middle School, and Nansemond River High School.
Ownership History
Date
Name
Owned For
Owner Type
Purchase Details
Closed on
Aug 31, 2016
Sold by
Felton Barbara A
Bought by
Cornelius Ashley M
Current Estimated Value
Home Financials for this Owner
Home Financials are based on the most recent Mortgage that was taken out on this home.
Original Mortgage
$186,558
Outstanding Balance
$149,350
Interest Rate
3.5%
Mortgage Type
FHA
Estimated Equity
$183,620
Purchase Details
Closed on
May 7, 2012
Sold by
Hampton Roads Holding Co Llc
Bought by
Felton Barbara A
Home Financials for this Owner
Home Financials are based on the most recent Mortgage that was taken out on this home.
Original Mortgage
$211,661
Interest Rate
4.08%
Mortgage Type
VA
Purchase Details
Closed on
Dec 7, 2011
Sold by
Rainey Iii Sub Tr T O and Lucas Karen D
Bought by
Hampton Roads Holding Co Llc
Create a Home Valuation Report for This Property
The Home Valuation Report is an in-depth analysis detailing your home's value as well as a comparison with similar homes in the area
Home Values in the Area
Average Home Value in this Area
Purchase History
| Date | Buyer | Sale Price | Title Company |
|---|---|---|---|
| Cornelius Ashley M | $190,000 | Advance Title & Abstract Inc | |
| Felton Barbara A | $204,900 | -- | |
| Hampton Roads Holding Co Llc | $24,550 | -- |
Source: Public Records
Mortgage History
| Date | Status | Borrower | Loan Amount |
|---|---|---|---|
| Open | Cornelius Ashley M | $186,558 | |
| Previous Owner | Hampton Roads Holding Co Llc | $211,661 |
Source: Public Records
Tax History Compared to Growth
Tax History
| Year | Tax Paid | Tax Assessment Tax Assessment Total Assessment is a certain percentage of the fair market value that is determined by local assessors to be the total taxable value of land and additions on the property. | Land | Improvement |
|---|---|---|---|---|
| 2024 | $3,555 | $280,300 | $69,100 | $211,200 |
| 2023 | $3,392 | $272,600 | $69,100 | $203,500 |
| 2022 | $2,716 | $249,200 | $69,100 | $180,100 |
| 2021 | $2,377 | $214,100 | $57,600 | $156,500 |
| 2020 | $2,203 | $198,500 | $57,600 | $140,900 |
| 2019 | $2,222 | $200,200 | $57,600 | $142,600 |
| 2018 | $2,294 | $198,100 | $57,600 | $140,500 |
| 2017 | $2,120 | $198,100 | $57,600 | $140,500 |
| 2016 | $2,120 | $198,100 | $57,600 | $140,500 |
| 2015 | $745 | $198,100 | $57,600 | $140,500 |
| 2014 | $745 | $198,100 | $57,600 | $140,500 |
Source: Public Records
Map
Nearby Homes
- 5621 Person St
- 4921 Clifton St
- 353 Canaan Cir
- 3408 Lynnhurst Blvd
- .18AC Clifton St
- 2000 Jehu St
- 4235 Marlin Ave
- 5001 Pearl St
- 5110 Hunters Creek Place
- 5207 Bartons Creek Ct
- 5029 John St
- 4500 John St
- 4225 Clifton St
- 3105 Moneta Dr
- 4650 Longleaf Place
- 4644 Longleaf Place
- 3503 Elaina Way
- 3505 Elaina Way
- 4639 Longleaf Place
- 3404 Newport Dr