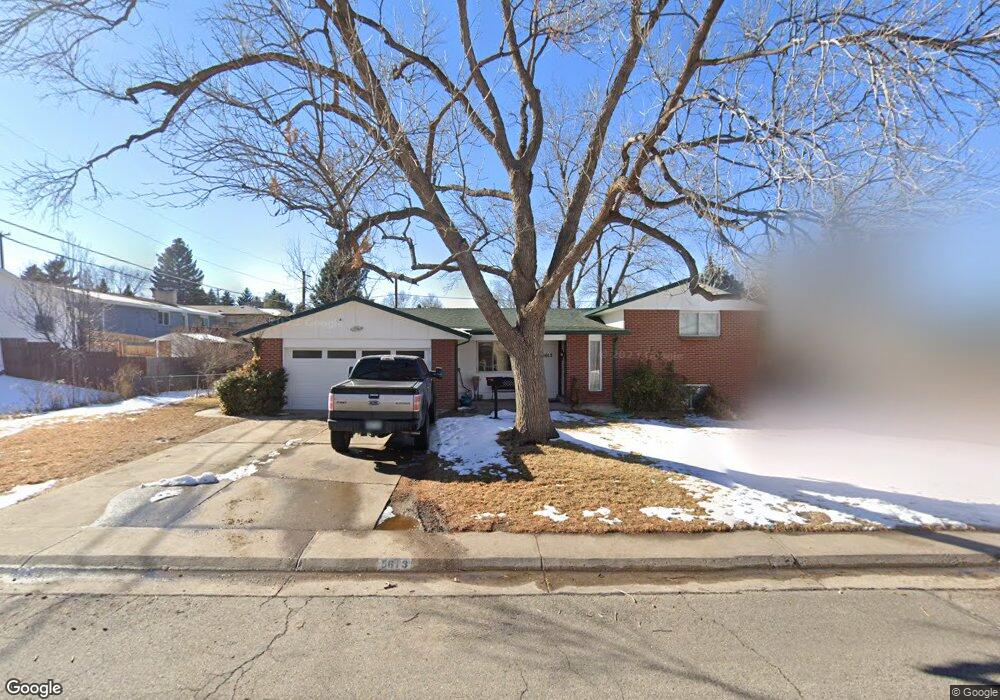
5613 Garrison St Arvada, CO 80002
Arvada Plaza Area NeighborhoodEstimated Value: $512,000 - $646,000
4
Beds
5
Baths
1,245
Sq Ft
$474/Sq Ft
Est. Value
About This Home
This home is located at 5613 Garrison St, Arvada, CO 80002 and is currently estimated at $589,535, approximately $473 per square foot. 5613 Garrison St is a home located in Jefferson County with nearby schools including Lawrence Elementary School, North Arvada Middle School, and Arvada High School.
Ownership History
Date
Name
Owned For
Owner Type
Purchase Details
Closed on
Jun 30, 2005
Sold by
Potter Noel L
Bought by
Potter Matthew L
Current Estimated Value
Home Financials for this Owner
Home Financials are based on the most recent Mortgage that was taken out on this home.
Original Mortgage
$200,000
Outstanding Balance
$108,351
Interest Rate
6.25%
Mortgage Type
Stand Alone First
Estimated Equity
$481,184
Purchase Details
Closed on
Jun 17, 2004
Sold by
Us Bank Na
Bought by
Potter Noel L
Home Financials for this Owner
Home Financials are based on the most recent Mortgage that was taken out on this home.
Original Mortgage
$100,000
Interest Rate
5.25%
Mortgage Type
Purchase Money Mortgage
Purchase Details
Closed on
Jan 22, 2004
Sold by
Clendening Sharon P and Clendening Chris E
Bought by
Us Bank Na and Csfb Heat Series 2002-3
Purchase Details
Closed on
Oct 8, 2003
Sold by
Bills Deborah
Bought by
Cooper Christina and Tennyson Anthony
Purchase Details
Closed on
Oct 2, 2003
Sold by
Clendening Sharon P
Bought by
Bills Deborah
Purchase Details
Closed on
May 3, 2002
Sold by
Clendening Sharon P
Bought by
Clendening Chris E and Clendening Sharon P
Home Financials for this Owner
Home Financials are based on the most recent Mortgage that was taken out on this home.
Original Mortgage
$204,000
Interest Rate
7.75%
Purchase Details
Closed on
Sep 7, 2000
Sold by
Clendening Chris E Powers Sharon M
Bought by
Clendening Sharon P
Purchase Details
Closed on
Apr 24, 2000
Sold by
Clendening Chris
Bought by
Clendening Chris E and Powers Sharon M
Purchase Details
Closed on
Sep 27, 1999
Sold by
Moreno Fred J and Moreno Denise R
Bought by
Clendening Chris E
Home Financials for this Owner
Home Financials are based on the most recent Mortgage that was taken out on this home.
Original Mortgage
$173,825
Interest Rate
8.02%
Mortgage Type
FHA
Purchase Details
Closed on
Jun 24, 1996
Sold by
Johnson Kathryn L
Bought by
Moreno Fred J and Moreno Denise R
Home Financials for this Owner
Home Financials are based on the most recent Mortgage that was taken out on this home.
Original Mortgage
$138,651
Interest Rate
8.33%
Mortgage Type
FHA
Create a Home Valuation Report for This Property
The Home Valuation Report is an in-depth analysis detailing your home's value as well as a comparison with similar homes in the area
Home Values in the Area
Average Home Value in this Area
Purchase History
| Date | Buyer | Sale Price | Title Company |
|---|---|---|---|
| Potter Matthew L | $250,000 | -- | |
| Potter Noel L | $200,000 | -- | |
| Us Bank Na | -- | -- | |
| Cooper Christina | -- | -- | |
| Bills Deborah | $1,000 | -- | |
| Clendening Chris E | -- | First American Heritage Titl | |
| Clendening Sharon P | -- | -- | |
| Clendening Sharon P | -- | -- | |
| Clendening Chris E | -- | -- | |
| Clendening Chris E | $175,000 | Land Title | |
| Moreno Fred J | $141,000 | First American Heritage Titl |
Source: Public Records
Mortgage History
| Date | Status | Borrower | Loan Amount |
|---|---|---|---|
| Open | Potter Matthew L | $200,000 | |
| Previous Owner | Potter Noel L | $100,000 | |
| Previous Owner | Clendening Chris E | $204,000 | |
| Previous Owner | Clendening Chris E | $173,825 | |
| Previous Owner | Moreno Fred J | $138,651 |
Source: Public Records
Tax History
| Year | Tax Paid | Tax Assessment Tax Assessment Total Assessment is a certain percentage of the fair market value that is determined by local assessors to be the total taxable value of land and additions on the property. | Land | Improvement |
|---|---|---|---|---|
| 2024 | $3,710 | $38,251 | $21,275 | $16,976 |
| 2023 | $3,710 | $38,251 | $21,275 | $16,976 |
| 2022 | $3,063 | $31,281 | $12,423 | $18,858 |
| 2021 | $3,114 | $32,182 | $12,781 | $19,401 |
| 2020 | $2,876 | $29,807 | $11,713 | $18,094 |
| 2019 | $2,838 | $29,807 | $11,713 | $18,094 |
| 2018 | $2,477 | $25,298 | $6,980 | $18,318 |
| 2017 | $2,268 | $25,298 | $6,980 | $18,318 |
| 2016 | $1,964 | $20,644 | $6,595 | $14,049 |
| 2015 | $1,696 | $20,644 | $6,595 | $14,049 |
| 2014 | $1,696 | $16,756 | $5,731 | $11,025 |
Source: Public Records
Map
Nearby Homes
- 9539 Grandview Ave
- 5420 Garland St
- 9609 W 57th Ave
- 9309 Highland Place
- 8967 W 54th Place
- 9546 W 58th Ave Unit B
- 5890 Holland Ct Unit B
- 9457 W 58th Ave Unit B
- 9487 W 58th Ave Unit B
- 9487 W 58th Ave Unit A
- 8735 W 54th Place
- 5600 Dover St
- 9300 W 53rd Place
- 5380 Johnson St
- 5360 Johnson St
- 8500 Clara Belle Dr
- 5257 Estes Cir
- 5369 Lynn Dr
- 6075 Garrison St
- 6077 Flower St
- 5633 Garrison St
- 5603 Garrison St
- 9229 Grandview Ave
- 9308 W 56th Place
- 9328 W 56th Place
- 5628 Garrison St
- 9249 Grandview Ave
- 9185 Grandview Ave
- 5638 Garrison St
- 5643 Garrison St
- 5648 Garrison St
- 9292 W 56th Place
- 9269 Grandview Ave
- 9348 W 56th Place
- 5658 Garrison St
- 5653 Garrison St
- 9319 Grandview Ave
- 9278 W 56th Place
- 9105 Grandview Ave
- 9329 W 56th Place
Your Personal Tour Guide
Ask me questions while you tour the home.