5613 Knell Ave Baltimore, MD 21206
Frankford NeighborhoodEstimated Value: $190,000 - $195,929
About This Home
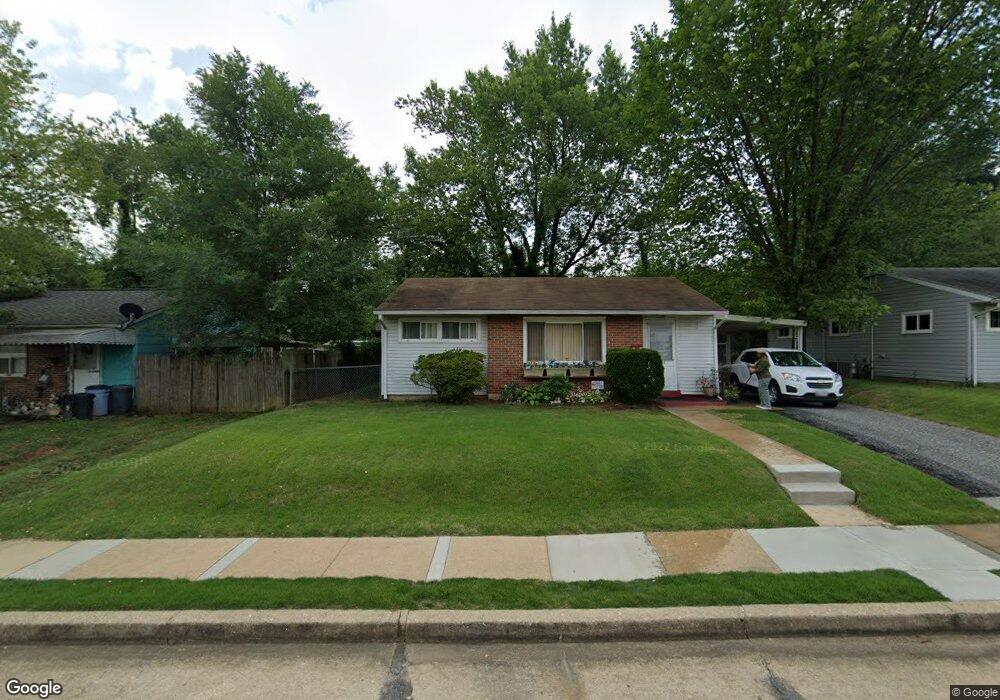
This home is located at 5613 Knell Ave, Baltimore, MD 21206 and is currently estimated at $192,965, approximately $241 per square foot. 5613 Knell Ave is a home located in Baltimore City with nearby schools including Hazelwood Elementary/Middle School, Booker T. Washington Middle School, and Patterson High School.
Ownership History
We collect this data history from publicly available records. To have your information removed, we recommend requesting removal directly through your county’s website.
Purchase Details
Home Financials for this Owner
Home Financials are based on the most recent Mortgage that was taken out on this home.Purchase Details
Home Financials for this Owner
Home Financials are based on the most recent Mortgage that was taken out on this home.Purchase Details
Purchase Details
Home Values in the Area
Average Home Value in this Area
Purchase History
We collect this data history from publicly available records. To have your information removed, we recommend requesting removal directly through your county’s website.
| Date | Buyer | Sale Price | Title Company |
|---|---|---|---|
| $129,900 | -- | ||
| $129,900 | -- | ||
| $80,900 | -- | ||
| $64,900 | -- |
Mortgage History
We collect this data history from publicly available records. To have your information removed, we recommend requesting removal directly through your county’s website.
| Date | Status | Borrower | Loan Amount |
|---|---|---|---|
| Open | $10,000 | ||
| Open | $103,920 | ||
| Closed | $10,000 | ||
| Previous Owner | $103,920 |
Tax History
We collect this data history from publicly available records. To have your information removed, we recommend requesting removal directly through your county’s website.
| Year | Tax Paid | Tax Assessment Tax Assessment Total Assessment is a certain percentage of the fair market value that is determined by local assessors to be the total taxable value of land and additions on the property. | Land | Improvement |
|---|---|---|---|---|
| 2025 | $2,417 | $116,467 | -- | -- |
| 2024 | $2,417 | $110,000 | $45,600 | $64,400 |
| 2023 | $2,412 | $110,000 | $45,600 | $64,400 |
| 2022 | $2,418 | $110,000 | $45,600 | $64,400 |
| 2021 | $2,613 | $110,700 | $45,600 | $65,100 |
| 2020 | $2,369 | $108,167 | $0 | $0 |
| 2019 | $2,297 | $105,633 | $0 | $0 |
| 2018 | $2,273 | $103,100 | $45,600 | $57,500 |
| 2017 | $2,202 | $102,400 | $0 | $0 |
| 2016 | $1,871 | $101,700 | $0 | $0 |
| 2015 | $1,871 | $101,000 | $0 | $0 |
| 2014 | $1,871 | $101,000 | $0 | $0 |
Map
- 4605 Anntana Ave
- 5608 Todd Ave
- 4804 Anntana Ave
- 5412 Summerfield Ave
- 5605 Anthony Ave
- 5511 Todd Ave
- 4401 Anntana Ave
- 5629 Greenhill Ave
- 4326 Berger Ave
- 4317 Berger Ave
- 4309 Willshire Ave
- 5643 Kavon Ave
- 5528 Bucknell Rd
- 4602 Sunbrook Ave
- 5404 Radecke Ave
- 4207 Arizona Ave
- 5928 Arizona Ave
- 4510 Bayonne Ave
- 5719 Kavon Ave
- 5300 Greenhill Ave
- 5615 Knell Ave
- 5611 Knell Ave
- 5608 Mayview Ave
- 5606 Mayview Ave
- 5617 Knell Ave
- 5609 Knell Ave
- 5610 Mayview Ave
- 5612 Knell Ave
- 5614 Knell Ave
- 5604 Mayview Ave
- 5610 Knell Ave
- 5612 Mayview Ave
- 5616 Knell Ave
- 5607 Knell Ave
- 5619 Knell Ave
- 5608 Knell Ave
- 5602 Mayview Ave
- 5614 Mayview Ave
- 5606 Knell Ave
- 5621 Knell Ave
Ask me questions while you tour the home.