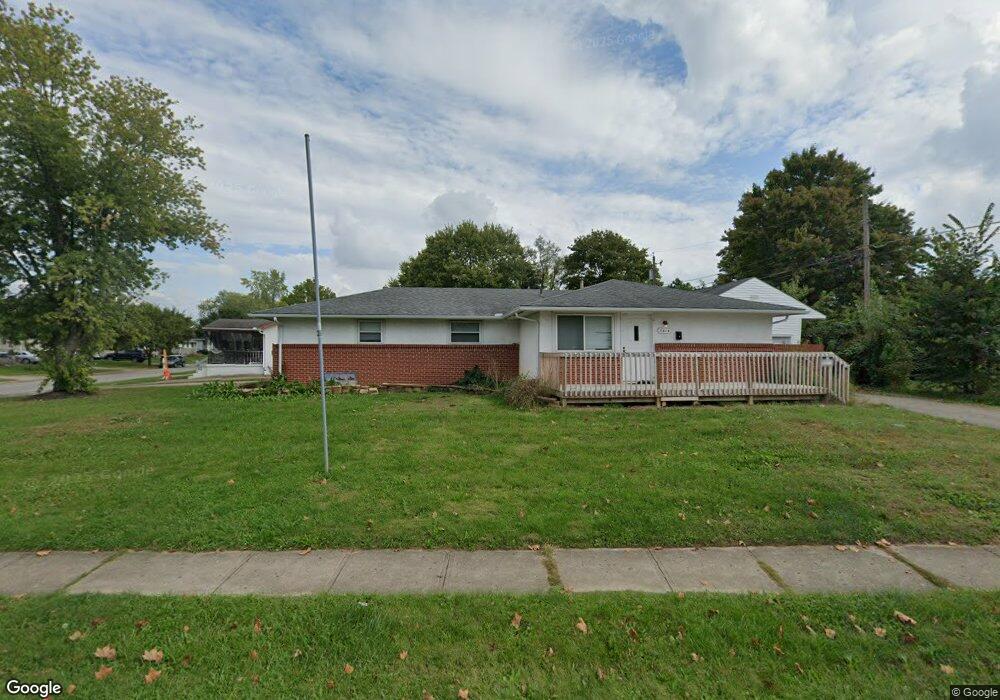
5614 Maple Canyon Ave Columbus, OH 43229
Forest Park East NeighborhoodEstimated Value: $278,281 - $312,000
4
Beds
3
Baths
1,536
Sq Ft
$193/Sq Ft
Est. Value
About This Home
This home is located at 5614 Maple Canyon Ave, Columbus, OH 43229 and is currently estimated at $296,820, approximately $193 per square foot. 5614 Maple Canyon Ave is a home located in Franklin County with nearby schools including Avalon Elementary School, Northgate Intermediate, and Woodward Park Middle School.
Ownership History
Date
Name
Owned For
Owner Type
Purchase Details
Closed on
May 29, 2003
Sold by
Maronitis Anthony B
Bought by
Lewis Thomas D and Lewis Cathy T
Current Estimated Value
Purchase Details
Closed on
Apr 2, 1999
Sold by
Maronitis Bill Anthony and Maronitis Christine
Bought by
Maronitis Anthony B
Home Financials for this Owner
Home Financials are based on the most recent Mortgage that was taken out on this home.
Original Mortgage
$108,000
Outstanding Balance
$27,120
Interest Rate
6.94%
Estimated Equity
$269,700
Purchase Details
Closed on
May 29, 1997
Sold by
Lewis James C
Bought by
Maronitis Anthony B and Maronitis Bill Anthony
Home Financials for this Owner
Home Financials are based on the most recent Mortgage that was taken out on this home.
Original Mortgage
$107,100
Interest Rate
8.27%
Purchase Details
Closed on
May 19, 1988
Purchase Details
Closed on
Sep 1, 1986
Create a Home Valuation Report for This Property
The Home Valuation Report is an in-depth analysis detailing your home's value as well as a comparison with similar homes in the area
Home Values in the Area
Average Home Value in this Area
Purchase History
| Date | Buyer | Sale Price | Title Company |
|---|---|---|---|
| Lewis Thomas D | $154,500 | Title First Agency Inc | |
| Maronitis Anthony B | -- | Connor Title Co | |
| Maronitis Anthony B | $119,000 | Connor Title Co | |
| -- | -- | -- | |
| -- | $72,000 | -- |
Source: Public Records
Mortgage History
| Date | Status | Borrower | Loan Amount |
|---|---|---|---|
| Open | Maronitis Anthony B | $108,000 | |
| Closed | Maronitis Anthony B | $107,100 |
Source: Public Records
Tax History Compared to Growth
Tax History
| Year | Tax Paid | Tax Assessment Tax Assessment Total Assessment is a certain percentage of the fair market value that is determined by local assessors to be the total taxable value of land and additions on the property. | Land | Improvement |
|---|---|---|---|---|
| 2024 | $3,871 | $84,460 | $18,870 | $65,590 |
| 2023 | $3,835 | $84,740 | $18,870 | $65,870 |
| 2022 | $2,429 | $45,710 | $10,220 | $35,490 |
| 2021 | $2,434 | $45,710 | $10,220 | $35,490 |
| 2020 | $2,558 | $45,710 | $10,220 | $35,490 |
| 2019 | $2,229 | $33,850 | $7,560 | $26,290 |
| 2018 | $2,332 | $33,850 | $7,560 | $26,290 |
| 2017 | $2,403 | $33,850 | $7,560 | $26,290 |
| 2016 | $2,678 | $39,170 | $8,050 | $31,120 |
| 2015 | $2,439 | $39,170 | $8,050 | $31,120 |
| 2014 | $2,395 | $39,170 | $8,050 | $31,120 |
| 2013 | $1,293 | $41,230 | $8,470 | $32,760 |
Source: Public Records
Map
Nearby Homes
- 2084 Brookfield Rd
- 5578 Parkshire Dr Unit 5578
- 5726 Beechcroft Rd Unit J
- 5556 Parkshire Dr Unit 5556
- 5522 Parkshire Dr Unit 5522
- 5732 Beechcroft Rd Unit B
- 1881 Brimfield Rd
- 1914 Walden Dr
- 2294 Teakwood Dr
- 2250 Webster Canyon Ct
- 5485 Tamarack Blvd
- 1752 Pine Tree St S Unit H
- 5727 Tamarack Blvd Unit A
- 1743 Pine Tree St N Unit A
- 5204 Honeytree Loop W
- 1722 Blue Ash Place
- 6019 Beechcroft Rd
- 1687 Brookfield Square S
- 6048 Pinemoor St
- 2058 Northcliff Dr
- 2127 Tupsfield Rd
- 2135 Tupsfield Rd
- 2143 Tupsfield Rd
- 2128 Shawbury Ct E
- 5600 Maple Canyon Ave Unit 602
- 2136 Shawbury Ct E
- 5619 Maple Canyon Ave
- 2149 Tupsfield Rd
- 2142 Shawbury Ct E
- 2128 Tupsfield Rd
- 5634 Maple Canyon Ave
- 2136 Tupsfield Rd
- 2140 Tupsfield Rd
- 5603 Maple Canyon Ave
- 2150 Shawbury Ct E
- 2155 Tupsfield Rd
- 2101 Tupsfield Rd
- 2144 Tupsfield Rd
- 2156 Shawbury Ct E
- 5659 Maple Canyon Ave