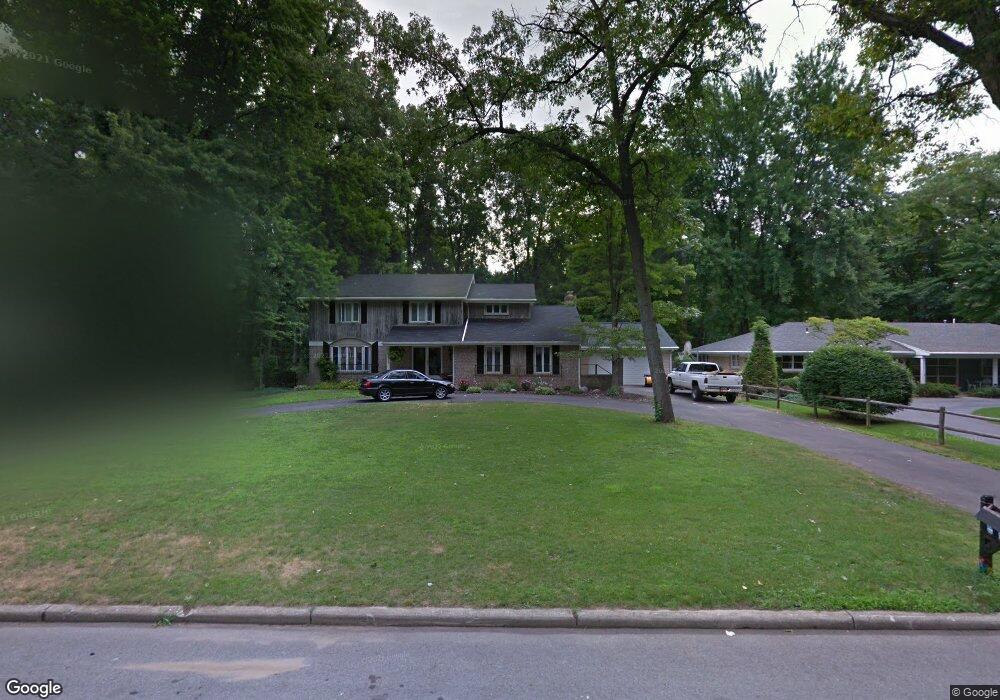
5614 Plantation Dr Toledo, OH 43623
Franklin Park NeighborhoodEstimated Value: $363,000 - $410,000
4
Beds
3
Baths
2,678
Sq Ft
$144/Sq Ft
Est. Value
About This Home
This home is located at 5614 Plantation Dr, Toledo, OH 43623 and is currently estimated at $386,225, approximately $144 per square foot. 5614 Plantation Dr is a home located in Lucas County with nearby schools including Hill View Elementary School, Sylvania Arbor Hills Junior High School, and Sylvania Northview High School.
Ownership History
Date
Name
Owned For
Owner Type
Purchase Details
Closed on
Sep 10, 2004
Sold by
Mckay Ryan
Bought by
Turner Ii James D and Turner Tiffany L
Current Estimated Value
Home Financials for this Owner
Home Financials are based on the most recent Mortgage that was taken out on this home.
Original Mortgage
$184,000
Outstanding Balance
$95,503
Interest Rate
6.6%
Mortgage Type
Purchase Money Mortgage
Estimated Equity
$290,722
Purchase Details
Closed on
May 9, 2002
Sold by
Thompson Debra S
Bought by
Mckay Ryan
Purchase Details
Closed on
Feb 11, 2000
Sold by
Thompson Gary L & Debra S Trustee
Bought by
Thompson Debra S
Purchase Details
Closed on
Oct 11, 1996
Sold by
Cook Karen S
Bought by
Thompson Gary L and Thompson Debra S
Home Financials for this Owner
Home Financials are based on the most recent Mortgage that was taken out on this home.
Original Mortgage
$87,000
Interest Rate
8.14%
Mortgage Type
New Conventional
Purchase Details
Closed on
Dec 11, 1992
Sold by
Ferguson James C
Create a Home Valuation Report for This Property
The Home Valuation Report is an in-depth analysis detailing your home's value as well as a comparison with similar homes in the area
Home Values in the Area
Average Home Value in this Area
Purchase History
| Date | Buyer | Sale Price | Title Company |
|---|---|---|---|
| Turner Ii James D | $230,000 | Area Title Agency Inc | |
| Mckay Ryan | $230,000 | Midland | |
| Thompson Debra S | -- | -- | |
| Thompson Gary L | $169,000 | -- | |
| -- | $135,000 | -- |
Source: Public Records
Mortgage History
| Date | Status | Borrower | Loan Amount |
|---|---|---|---|
| Open | Turner Ii James D | $184,000 | |
| Previous Owner | Thompson Gary L | $87,000 | |
| Closed | Turner Ii James D | $46,000 |
Source: Public Records
Tax History Compared to Growth
Tax History
| Year | Tax Paid | Tax Assessment Tax Assessment Total Assessment is a certain percentage of the fair market value that is determined by local assessors to be the total taxable value of land and additions on the property. | Land | Improvement |
|---|---|---|---|---|
| 2024 | $2,520 | $117,880 | $16,380 | $101,500 |
| 2023 | $7,244 | $96,600 | $13,755 | $82,845 |
| 2022 | $7,248 | $96,600 | $13,755 | $82,845 |
| 2021 | $7,424 | $96,600 | $13,755 | $82,845 |
| 2020 | $7,107 | $81,865 | $11,585 | $70,280 |
| 2019 | $6,846 | $81,865 | $11,585 | $70,280 |
| 2018 | $6,115 | $81,865 | $11,585 | $70,280 |
| 2017 | $5,834 | $63,455 | $12,180 | $51,275 |
| 2016 | $5,723 | $181,300 | $34,800 | $146,500 |
| 2015 | $5,397 | $181,300 | $34,800 | $146,500 |
| 2014 | $5,140 | $61,050 | $11,730 | $49,320 |
| 2013 | $5,140 | $61,050 | $11,730 | $49,320 |
Source: Public Records
Map
Nearby Homes
- 5539 Ginger Tree Ln
- 4810 Forest Hill Dr
- 5822 Friedly Dr
- 4832 Alexis Rd
- 4816 Sunwood Dr
- 4504 Sulgrave Dr
- 5344 Talmadge Rd
- 4733 High Oaks Blvd
- 4941 Gorham Place
- 5565 Steffens Ave
- 5838 Vail Ave
- 5762 Steffens Ave
- 5043 Barton Place
- 5266 Whiteford Rd
- 5563 Harschel Dr
- 5404 Harschel Dr
- 4943 Flanders Rd
- 4122 Briarcrest Rd
- 5202 Arbor Way
- 5664 Stewart Rd
- 5604 Plantation Dr
- 5624 Plantation Dr
- 5569 Ginger Tree Ln
- 5634 Plantation Dr
- 5573 Ginger Tree Ln
- 5615 Plantation Dr
- 5565 Ginger Tree Ln
- 5605 Plantation Dr
- 5625 Plantation Dr
- 5577 Ginger Tree Ln
- 4560 Ginger Trail
- 5644 Plantation Dr
- 5635 Plantation Dr
- 4542 Ginger Trail
- 5607 Ginger Tree Ln
- 5555 Plantation Dr
- 5645 Plantation Dr
- 5561 Ginger Tree Ln
- 5654 Plantation Dr
- 5574 Ginger Tree Ln