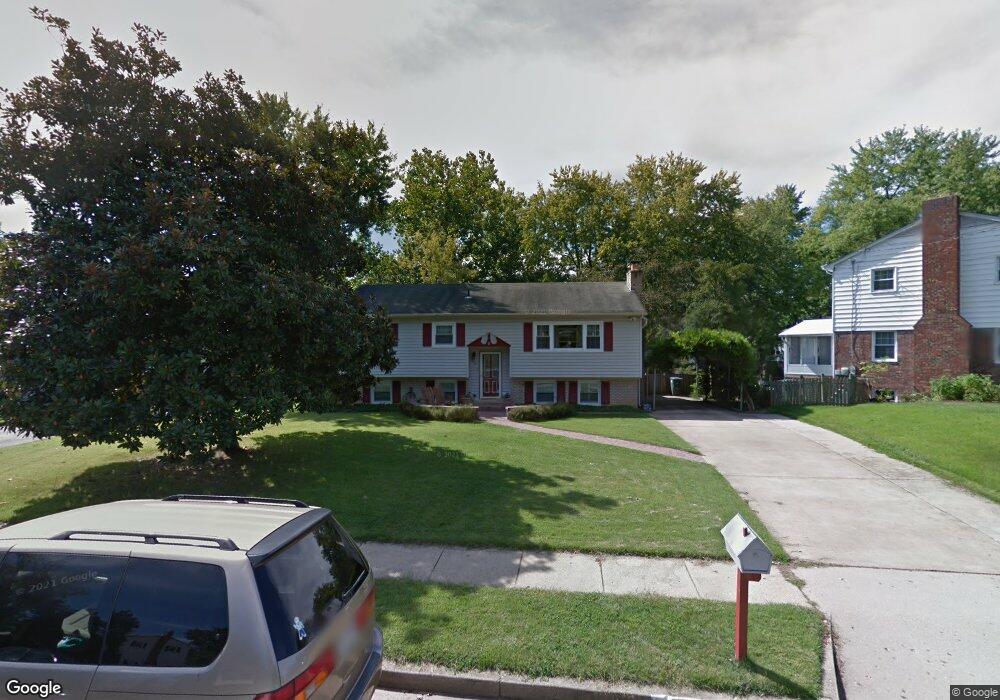
5615 Marble Arch Way Alexandria, VA 22315
Estimated Value: $709,000 - $746,000
4
Beds
2
Baths
1,132
Sq Ft
$638/Sq Ft
Est. Value
About This Home
This home is located at 5615 Marble Arch Way, Alexandria, VA 22315 and is currently estimated at $721,936, approximately $637 per square foot. 5615 Marble Arch Way is a home located in Fairfax County with nearby schools including Hayfield Elementary School, Hayfield Secondary School, and Calvary Road Christian School & Preschool.
Ownership History
Date
Name
Owned For
Owner Type
Purchase Details
Closed on
Nov 29, 2022
Sold by
Hyman Eli S
Bought by
Clifford Allison Elaine and Clifford Andrew Herlan
Current Estimated Value
Home Financials for this Owner
Home Financials are based on the most recent Mortgage that was taken out on this home.
Original Mortgage
$608,000
Outstanding Balance
$589,755
Interest Rate
6.95%
Mortgage Type
New Conventional
Estimated Equity
$132,181
Purchase Details
Closed on
Mar 26, 2004
Sold by
James Clifford F
Bought by
Hyman Eli S
Home Financials for this Owner
Home Financials are based on the most recent Mortgage that was taken out on this home.
Original Mortgage
$312,000
Interest Rate
5.65%
Mortgage Type
New Conventional
Purchase Details
Closed on
Jun 28, 2000
Sold by
Dodge John Addison
Bought by
James Clifford
Home Financials for this Owner
Home Financials are based on the most recent Mortgage that was taken out on this home.
Original Mortgage
$177,600
Interest Rate
8.59%
Create a Home Valuation Report for This Property
The Home Valuation Report is an in-depth analysis detailing your home's value as well as a comparison with similar homes in the area
Home Values in the Area
Average Home Value in this Area
Purchase History
| Date | Buyer | Sale Price | Title Company |
|---|---|---|---|
| Clifford Allison Elaine | $640,000 | Commonwealth Land Title | |
| Hyman Eli S | $390,000 | -- | |
| James Clifford | $222,000 | -- |
Source: Public Records
Mortgage History
| Date | Status | Borrower | Loan Amount |
|---|---|---|---|
| Open | Clifford Allison Elaine | $608,000 | |
| Previous Owner | Hyman Eli S | $312,000 | |
| Previous Owner | James Clifford | $177,600 |
Source: Public Records
Tax History Compared to Growth
Tax History
| Year | Tax Paid | Tax Assessment Tax Assessment Total Assessment is a certain percentage of the fair market value that is determined by local assessors to be the total taxable value of land and additions on the property. | Land | Improvement |
|---|---|---|---|---|
| 2025 | $7,099 | $659,270 | $330,000 | $329,270 |
| 2024 | $7,099 | $612,740 | $315,000 | $297,740 |
| 2023 | $6,840 | $606,130 | $315,000 | $291,130 |
| 2022 | $6,518 | $570,010 | $285,000 | $285,010 |
| 2021 | $6,276 | $534,850 | $255,000 | $279,850 |
| 2020 | $5,847 | $494,080 | $220,000 | $274,080 |
| 2019 | $5,697 | $481,410 | $217,000 | $264,410 |
| 2018 | $5,379 | $467,710 | $211,000 | $256,710 |
| 2017 | $5,218 | $449,470 | $203,000 | $246,470 |
| 2016 | $5,207 | $449,470 | $203,000 | $246,470 |
| 2015 | $5,016 | $449,470 | $203,000 | $246,470 |
| 2014 | $4,899 | $439,980 | $199,000 | $240,980 |
Source: Public Records
Map
Nearby Homes
- 5803 Sunderland Ct
- 7520 Amesbury Ct
- 7462 Towchester Ct
- 7460 Towchester Ct
- 5623 Glenwood Mews Dr
- 5606 Glenwood Mews Dr
- 7472 Cross Gate Ln
- 5905 Saint Giles Way
- 7235 Worsley Way
- 7204 Racepoint Way
- 7913 Fitzroy St
- 5405 Dunsmore Rd
- 7770 Belvale Dr
- 7922 Ashland Dr
- 5321 Buxton Ct
- 8139 Keeler St
- 8012 Frye Rd
- 4813 Lawrence St
- 8014 Steadman St
- 6169 Windham Hill Run
- 5613 Marble Arch Way
- 5617 Marble Arch Way
- 5471 Broadmoor St
- 7803 Hayfield Rd
- 7805 Hayfield Rd
- 5611 Marble Arch Way
- 5469 Broadmoor St
- 5614 Marble Arch Way
- 7807 Hayfield Rd
- 5508 Broadmoor St
- 5612 Marble Arch Way
- 5609 Marble Arch Way
- 5701 Marble Arch Way
- 7809 Hayfield Rd
- 5472 Broadmoor St
- 5510 Broadmoor St
- 7727 Hayfield Rd
- 5612 Hereford Ct
- 5700 Marble Arch Way
- 5613 Hereford Ct