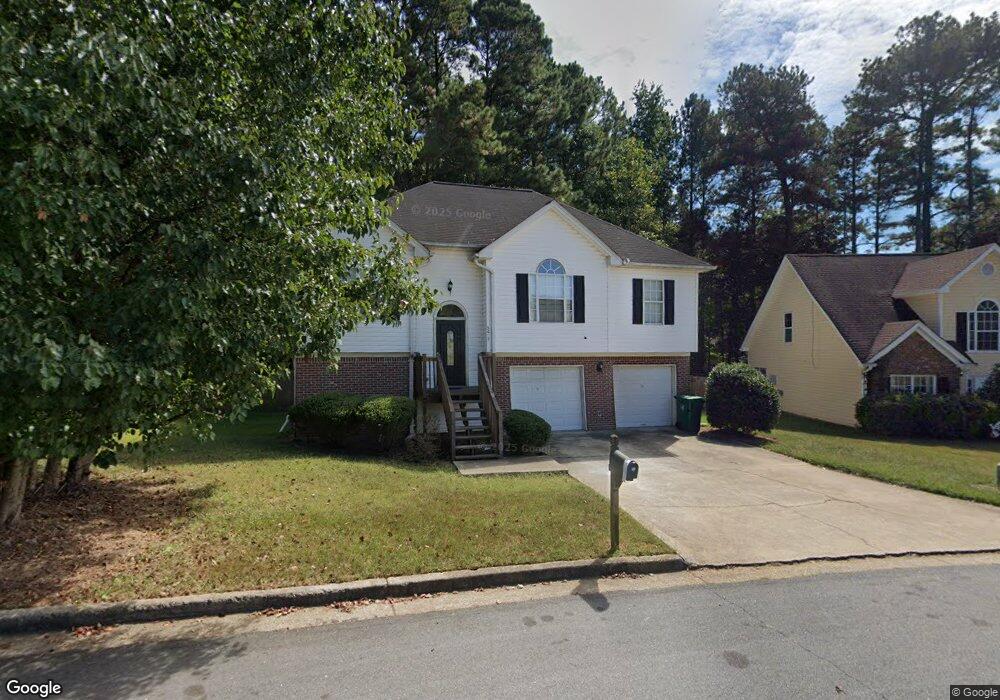
5615 Mayfair Crossing Dr Unit 1 Lithonia, GA 30038
Estimated Value: $234,895 - $276,000
3
Beds
2
Baths
1,701
Sq Ft
$145/Sq Ft
Est. Value
About This Home
This home is located at 5615 Mayfair Crossing Dr Unit 1, Lithonia, GA 30038 and is currently estimated at $247,224, approximately $145 per square foot. 5615 Mayfair Crossing Dr Unit 1 is a home located in DeKalb County with nearby schools including Fairington Elementary School, Salem Middle School, and Martin Luther King- Jr. High School.
Ownership History
Date
Name
Owned For
Owner Type
Purchase Details
Closed on
Feb 15, 2019
Sold by
P Fin Ii Llc
Bought by
Pfin Ii F Llc
Current Estimated Value
Purchase Details
Closed on
May 15, 2017
Sold by
Not Provided
Bought by
P Fin Ii Llc
Purchase Details
Closed on
Jun 30, 2014
Sold by
Colfin Ai Ga 1 Llc
Bought by
Cah 2014 2 Borrower Llc
Purchase Details
Closed on
May 7, 2013
Sold by
Fischkelta Harry
Bought by
Colfin Ai Ga 1 Llc
Purchase Details
Closed on
May 2, 2011
Sold by
Arkue Klabeh
Bought by
Fischkelta Harry F
Purchase Details
Closed on
Dec 29, 2005
Sold by
Reid Valerie A
Bought by
Fischkelta Harry F
Home Financials for this Owner
Home Financials are based on the most recent Mortgage that was taken out on this home.
Original Mortgage
$111,200
Interest Rate
6.18%
Mortgage Type
New Conventional
Purchase Details
Closed on
Feb 5, 1997
Sold by
Mcmillan Mcdonald Bldrs Tina
Bought by
Reid Valerie A
Create a Home Valuation Report for This Property
The Home Valuation Report is an in-depth analysis detailing your home's value as well as a comparison with similar homes in the area
Home Values in the Area
Average Home Value in this Area
Purchase History
| Date | Buyer | Sale Price | Title Company |
|---|---|---|---|
| Pfin Ii F Llc | -- | -- | |
| P Fin Ii Llc | $3,454,944 | -- | |
| Cah 2014 2 Borrower Llc | -- | -- | |
| Colfin Ai Ga 1 Llc | $81,000 | -- | |
| Colfin Ai Ga 1 Llc | $81,000 | -- | |
| Fischkelta Harry F | -- | -- | |
| Fischkelta Harry F | $139,000 | -- | |
| Reid Valerie A | $89,900 | -- |
Source: Public Records
Mortgage History
| Date | Status | Borrower | Loan Amount |
|---|---|---|---|
| Previous Owner | Fischkelta Harry F | $111,200 | |
| Closed | Reid Valerie A | $0 |
Source: Public Records
Tax History Compared to Growth
Tax History
| Year | Tax Paid | Tax Assessment Tax Assessment Total Assessment is a certain percentage of the fair market value that is determined by local assessors to be the total taxable value of land and additions on the property. | Land | Improvement |
|---|---|---|---|---|
| 2025 | $4,837 | $97,800 | $20,000 | $77,800 |
| 2024 | $4,011 | $79,920 | $9,590 | $70,330 |
| 2023 | $4,011 | $79,920 | $9,590 | $70,330 |
| 2022 | $3,143 | $79,920 | $9,520 | $70,400 |
| 2021 | $3,187 | $63,480 | $9,520 | $53,960 |
| 2020 | $2,218 | $42,207 | $8,608 | $33,599 |
| 2019 | $2,599 | $51,160 | $9,480 | $41,680 |
| 2018 | $1,572 | $42,206 | $8,608 | $33,598 |
| 2017 | $1,930 | $35,758 | $8,940 | $26,819 |
| 2016 | $1,934 | $42,520 | $9,480 | $33,040 |
| 2014 | $1,232 | $19,400 | $9,480 | $9,920 |
Source: Public Records
Map
Nearby Homes
- 5585 Fairington Place
- 3027 Fair Creek Ct
- 5556 Claridge Cir Unit 1
- 3026 Highland Park Ln Unit II
- 2700 Norfair Loop
- 5614 Regency Forest Ct
- 38 Le Parc Fontaine
- 177 Rue Fontaine Unit 2
- 5619 Regency Forest Ct Unit 2
- 2995 Hampton Club Way
- 2892 Norfair Loop
- 54 Le Parc Fontaine
- 2878 Norfair Loop
- 3304 Fairington Village Dr
- 3204 Fairington Village Dr
- 125 Rue Fontaine
- 3102 Fairington Village Dr
- 38 Willowick Ct
- 3203 Fairington Ridge Cir
- 9 Willowick Dr
- 5611 Mayfair Crossing Dr
- 5607 Mayfair Crossing Dr
- 5623 Mayfair Crossing Dr
- 5616 Mayfair Crossing Dr
- 2974 Phillips Way
- 5601 Mayfair Crossing Dr
- 5594 Bradley Cir
- 5605 Claridge Cir Unit 1
- 2980 Phillips Way
- 5602 Claridge Cir Unit I
- 5627 Mayfair Crossing Dr
- 5627 Mayfair Crossing Dr Unit 1
- 5597 Mayfair Crossing Dr
- 5626 Mayfair Crossing Dr
- 5600 Mayfair Crossing Dr
- 5598 Bradley Cir
- 2975 Phillips Way
- 5596 Mayfair Crossing Dr
- 5591 Mayfair Crossing Dr Unit 1
- 5604 Bradley Cir