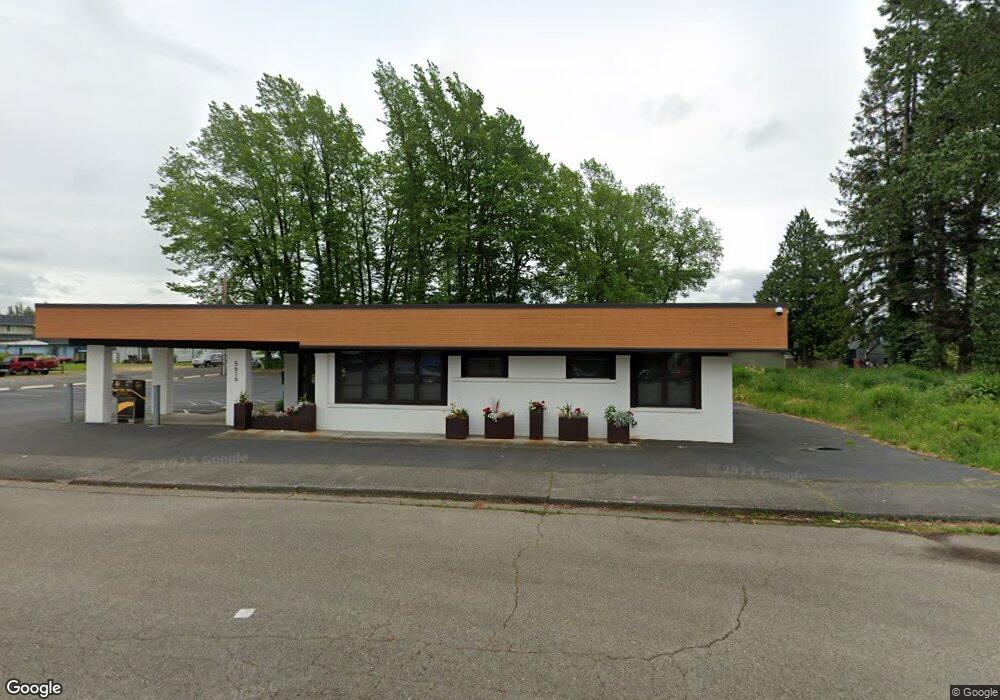
5616 3rd Ave Ferndale, WA 98248
Estimated Value: $718,257
Studio
--
Bath
3,570
Sq Ft
$201/Sq Ft
Est. Value
About This Home
This home is located at 5616 3rd Ave, Ferndale, WA 98248 and is currently estimated at $718,257, approximately $201 per square foot. 5616 3rd Ave is a home located in Whatcom County with nearby schools including Central Elementary School, Vista Middle School, and Ferndale High School.
Ownership History
Date
Name
Owned For
Owner Type
Purchase Details
Closed on
Sep 26, 2023
Sold by
Whatcom Land Title
Bought by
Mbcb Properties Llc
Current Estimated Value
Home Financials for this Owner
Home Financials are based on the most recent Mortgage that was taken out on this home.
Original Mortgage
$452,737
Outstanding Balance
$442,277
Interest Rate
7.18%
Mortgage Type
New Conventional
Estimated Equity
$275,980
Purchase Details
Closed on
Oct 7, 2021
Sold by
Fern Llc
Bought by
Whatcom Land Title Company Inc
Home Financials for this Owner
Home Financials are based on the most recent Mortgage that was taken out on this home.
Original Mortgage
$474,750
Interest Rate
2.8%
Mortgage Type
Commercial
Purchase Details
Closed on
Jan 6, 2020
Sold by
Willis Jr John T and Willis Frances M
Bought by
Morris Steven and Morris Sharon
Purchase Details
Closed on
Sep 8, 2014
Sold by
Pea Pod Industries Llc
Bought by
Fern Llc
Purchase Details
Closed on
Mar 28, 2014
Sold by
Belay Llc
Bought by
Pea Pod Industries Llc
Purchase Details
Closed on
Oct 12, 2007
Sold by
Peterson Allen C and Peterson Kristeen M
Bought by
Belay Llc
Home Financials for this Owner
Home Financials are based on the most recent Mortgage that was taken out on this home.
Original Mortgage
$450,000
Interest Rate
6.42%
Mortgage Type
Commercial
Purchase Details
Closed on
Jan 28, 2005
Sold by
Snyder Gary R and Snyder Alix Ann
Bought by
Peterson Allen C and Peterson Kristeen M
Home Financials for this Owner
Home Financials are based on the most recent Mortgage that was taken out on this home.
Original Mortgage
$249,000
Interest Rate
5.81%
Mortgage Type
Commercial
Create a Home Valuation Report for This Property
The Home Valuation Report is an in-depth analysis detailing your home's value as well as a comparison with similar homes in the area
Home Values in the Area
Average Home Value in this Area
Purchase History
| Date | Buyer | Sale Price | Title Company |
|---|---|---|---|
| Mbcb Properties Llc | $313 | Whatcom Land Title | |
| Mbcb Properties Llc | $313 | Whatcom Land Title | |
| Whatcom Land Title Company Inc | $633,000 | Whatcom Land Title | |
| Whatcom Land Title Company Inc | $633,000 | Whatcom Land Title | |
| Morris Steven | $7,045,000 | Chicago Title | |
| Morris Steven | $7,045,000 | Chicago Title | |
| Fern Llc | -- | None Available | |
| Fern Llc | -- | None Available | |
| Pea Pod Industries Llc | $965,280 | First American Title Ins | |
| Pea Pod Industries Llc | $965,280 | First American Title Ins | |
| Belay Llc | $450,280 | Stewart Title Company | |
| Belay Llc | $450,280 | Stewart Title Company | |
| Peterson Allen C | $349,500 | First American Title Insuran | |
| Peterson Allen C | $349,500 | First American Title Insuran |
Source: Public Records
Mortgage History
| Date | Status | Borrower | Loan Amount |
|---|---|---|---|
| Open | Mbcb Properties Llc | $452,737 | |
| Previous Owner | Whatcom Land Title Company Inc | $474,750 | |
| Previous Owner | Belay Llc | $450,000 | |
| Previous Owner | Peterson Allen C | $249,000 |
Source: Public Records
Tax History
| Year | Tax Paid | Tax Assessment Tax Assessment Total Assessment is a certain percentage of the fair market value that is determined by local assessors to be the total taxable value of land and additions on the property. | Land | Improvement |
|---|---|---|---|---|
| 2025 | $6,145 | $822,600 | $288,400 | $534,200 |
| 2024 | $5,700 | $819,596 | $280,000 | $539,596 |
| 2023 | $5,700 | $819,596 | $280,000 | $539,596 |
| 2022 | $7,380 | $636,519 | $247,181 | $389,338 |
| 2021 | $6,690 | $824,411 | $204,288 | $620,123 |
| 2020 | $7,436 | $687,009 | $170,240 | $516,769 |
| 2019 | $6,110 | $687,009 | $170,240 | $516,769 |
| 2018 | $8,131 | $670,907 | $166,250 | $504,657 |
| 2017 | $5,519 | $670,907 | $166,250 | $504,657 |
| 2016 | $5,502 | $492,560 | $131,600 | $360,960 |
| 2015 | $5,752 | $492,560 | $131,600 | $360,960 |
| 2014 | -- | $503,040 | $134,400 | $368,640 |
| 2013 | -- | $503,040 | $134,400 | $368,640 |
Source: Public Records
Map
Nearby Homes
- 2071 Cherry St Unit 7
- 5604 3rd Ave
- 5698 2nd Ave
- 5646 Correll Ct
- 0 2nd Ave
- 5682 Correll Dr Unit 102
- 2155 Siddle Loop Unit 1-6
- 5788 Vista Dr
- 2234 Main St
- 2173 Sunnybrook Ln Unit 202
- 2273 Douglas Rd
- 5786 Portal Way
- 5779 Legoe Ave
- 5682 Sunstone Place Unit 103
- 5683 Sunstone Place Unit 102
- 2344 Main St
- 2392 Douglas Rd Unit 39
- 5874 Sherry Place
- 5585 Farmstead Place Unit 4
- 5893 Aspen Place
Your Personal Tour Guide
Ask me questions while you tour the home.