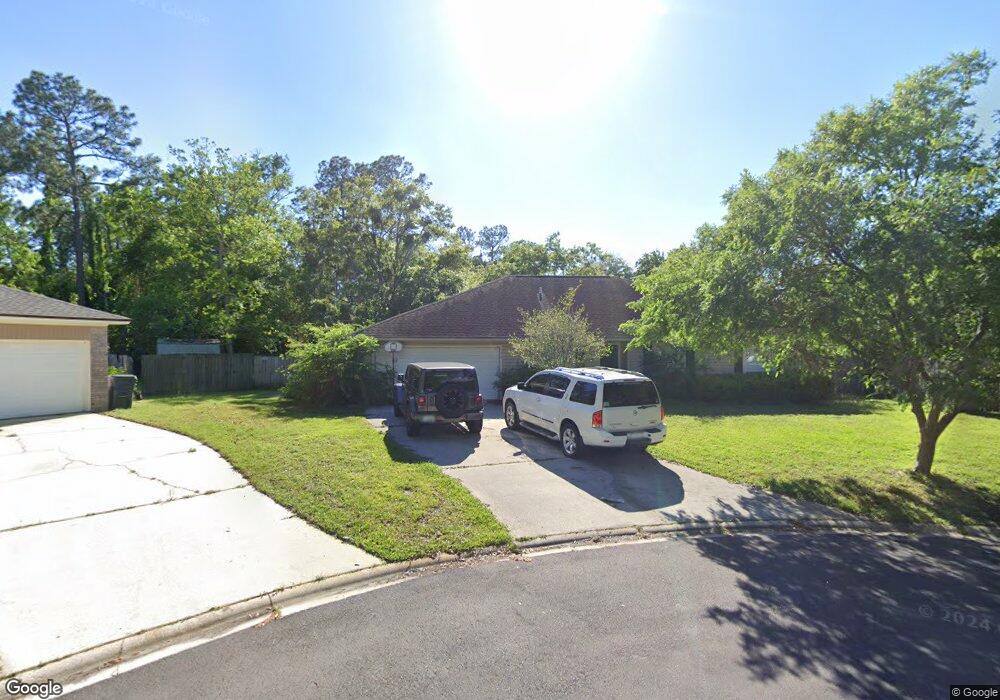
5616 Fallbrook Ct Fleming Island, FL 32003
Estimated Value: $343,937 - $396,000
About This Home
Please note, our homes are available on a first-come, first-serve basis and are not reserved until the lease is signed by all applicants and security deposits are collected.
This home features Progress Smart Home - Progress Residential's smart home app, which allows you to control the home securely from any of your devices. Learn more at
Want to tour on your own? Click the “Self Tour” button on this home’s listing or call to register for a self-guided showing at a time that works best for you.
This wonderful neighborhood is just a short drive to shopping, dining, and more! This home located on a Cul-de sac has new carpet in the bedrooms. Upon entry you will find a great room that is overlooked by a nicely upgraded kitchen including an all new stainless steel appliance package, wood cabinetry, and breakfast bar. The split floor plan in this home leaves plenty of privacy for everyone with guest rooms on one side of the home, and the master suite on the other. This master suite offers a huge walk in closet and a spacious master bath. This home offers the convenience of an indoor laundry and a two car garage and fenced in backyard with a covered patio. Walking distance from the Elementary school. Make this your home today!
Ownership History
Purchase Details
Purchase Details
Purchase Details
Purchase Details
Purchase Details
Home Financials for this Owner
Home Financials are based on the most recent Mortgage that was taken out on this home.Purchase Details
Home Financials for this Owner
Home Financials are based on the most recent Mortgage that was taken out on this home.Purchase Details
Home Financials for this Owner
Home Financials are based on the most recent Mortgage that was taken out on this home.Purchase Details
Home Values in the Area
Average Home Value in this Area
Purchase History
| Date | Buyer | Sale Price | Title Company |
|---|---|---|---|
| True North Property Owner B Llc | -- | New Title Company Name | |
| Pmc Sfr Borrower 2 Llc | -- | Servicelink Llc | |
| Pretium Sfr Holdings Llc | -- | Os National Llc | |
| Wilmington Savings Fund Society | -- | None Available | |
| Dollar James C | $215,000 | Watson & Osborne Title Servi | |
| Wentzell Keith D | $164,900 | First American Title Ins Co | |
| Borland Peter L | $132,000 | -- | |
| Merrett Thomas A | -- | -- |
Mortgage History
| Date | Status | Borrower | Loan Amount |
|---|---|---|---|
| Previous Owner | Dollar James C | $172,000 | |
| Previous Owner | Wentzell Keith D | $170,282 | |
| Previous Owner | Borland Peter L | $134,600 |
Property History
| Date | Event | Price | List to Sale | Price per Sq Ft |
|---|---|---|---|---|
| 10/10/2024 10/10/24 | For Rent | $1,915 | 0.0% | -- |
| 09/24/2024 09/24/24 | Price Changed | $1,915 | -2.0% | $1 / Sq Ft |
| 09/23/2024 09/23/24 | Price Changed | $1,955 | -2.0% | $1 / Sq Ft |
| 09/17/2024 09/17/24 | Price Changed | $1,995 | -5.0% | $1 / Sq Ft |
| 09/17/2024 09/17/24 | Price Changed | $2,100 | -3.9% | $1 / Sq Ft |
| 09/07/2024 09/07/24 | For Rent | $2,185 | -- | -- |
Tax History
| Year | Tax Paid | Tax Assessment Tax Assessment Total Assessment is a certain percentage of the fair market value that is determined by local assessors to be the total taxable value of land and additions on the property. | Land | Improvement |
|---|---|---|---|---|
| 2025 | $4,467 | $323,767 | $50,000 | $273,767 |
| 2024 | $4,583 | $319,729 | $50,000 | $269,729 |
| 2023 | $4,583 | $313,800 | $50,000 | $263,800 |
| 2022 | $3,866 | $250,409 | $40,000 | $210,409 |
| 2021 | $3,525 | $211,682 | $30,000 | $181,682 |
| 2020 | $3,235 | $197,710 | $30,000 | $167,710 |
| 2019 | $3,042 | $182,933 | $30,000 | $152,933 |
| 2018 | $2,692 | $170,652 | $0 | $0 |
| 2017 | $2,731 | $170,111 | $0 | $0 |
| 2016 | $1,732 | $139,232 | $0 | $0 |
| 2015 | $1,780 | $138,264 | $0 | $0 |
| 2014 | $1,735 | $137,167 | $0 | $0 |
Map
- 1837 Weston Cir
- 2103 Hawkeye Place
- 1809 Weston Cir
- 636 Cozybrook Ln
- 1653 Shady River Ct
- 182 Malley Cove Ln
- 426 Harvest Bend Dr
- 211 Riverwood Dr
- 2200 Marsh Hawk Ln Unit 403
- 2200 Marsh Hawk Ln Unit 113
- 1820 Copper Stone Dr Unit D
- 1830 Copper Stone Dr Unit E
- 170 N Ridge Dr
- 627 Martinique Ct
- 1840 Copper Stone Dr Unit D
- 488 Pine Eagle Dr
- 1860 Copper Stone Dr Unit C
- 1870 Copper Stone Dr Unit F
- 149 Riverwood Dr
- 6215 Leeward Ct
- 5623 Candibrook Ln
- 5608 Fallbrook Ct
- 582 Timbercrest Ln
- 5626 Candibrook Ln
- 550 Timbercrest Ln
- 5617 Fallbrook Ct
- 555 Timbercrest Ln
- 5614 Candibrook Ln
- 581 Timbercrest Ln
- 567 Timbercrest Ln
- 5602 Candibrook Ln
- 575 Pine Forest Dr N
- 540 Timbercrest Ln
- 547 Timbercrest Ln
- 482 Springbrook Dr
- 5548 Candibrook Ln
- 2001 Hawkeye Place
- 587 Pine Forest Dr N
- 5529 Candibrook Ln
- 539 Timbercrest Ln
Ask me questions while you tour the home.