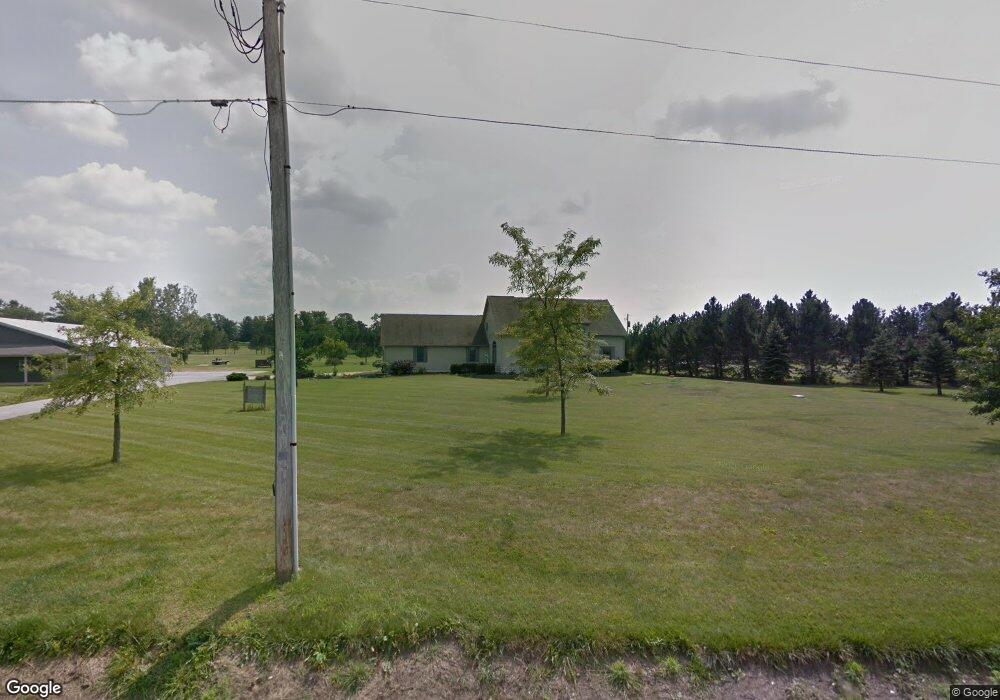
5617 Edmonds Rd Bellevue, OH 44811
Estimated Value: $189,000 - $244,000
3
Beds
1
Bath
1,824
Sq Ft
$119/Sq Ft
Est. Value
About This Home
This home is located at 5617 Edmonds Rd, Bellevue, OH 44811 and is currently estimated at $216,798, approximately $118 per square foot. 5617 Edmonds Rd is a home located in Huron County with nearby schools including Bellevue Elementary School, Bellevue Middle School, and Bellevue High School.
Ownership History
Date
Name
Owned For
Owner Type
Purchase Details
Closed on
Dec 14, 2017
Sold by
Todd Theodore Jon and Sutherland Robert E
Bought by
Heyman Blake L
Current Estimated Value
Home Financials for this Owner
Home Financials are based on the most recent Mortgage that was taken out on this home.
Original Mortgage
$103,000
Outstanding Balance
$86,717
Interest Rate
3.94%
Mortgage Type
New Conventional
Estimated Equity
$130,081
Purchase Details
Closed on
Feb 28, 2005
Bought by
Todd Theodore Jon and Suther Robert E
Purchase Details
Closed on
Oct 27, 2004
Bought by
Sutherland Bobby Trustees
Purchase Details
Closed on
Feb 15, 2000
Bought by
Sutherland Debra K
Purchase Details
Closed on
Aug 30, 1999
Sold by
Clancy Cynthia S
Bought by
Debra K Sutherland
Purchase Details
Closed on
Jan 5, 1999
Bought by
Fransen Deborah
Purchase Details
Closed on
Aug 18, 1998
Bought by
Dreisbach Gerald F W and Dreisbach Le
Purchase Details
Closed on
Sep 17, 1990
Bought by
Dreisbach Gerald F
Create a Home Valuation Report for This Property
The Home Valuation Report is an in-depth analysis detailing your home's value as well as a comparison with similar homes in the area
Home Values in the Area
Average Home Value in this Area
Purchase History
| Date | Buyer | Sale Price | Title Company |
|---|---|---|---|
| Heyman Blake L | $128,800 | None Available | |
| Todd Theodore Jon | -- | -- | |
| Sutherland Bobby Trustees | -- | -- | |
| Sutherland Debra K | -- | -- | |
| Debra K Sutherland | $52,000 | -- | |
| Fransen Deborah | -- | -- | |
| Dreisbach Gerald F W | -- | -- | |
| Dreisbach Gerald F | -- | -- |
Source: Public Records
Mortgage History
| Date | Status | Borrower | Loan Amount |
|---|---|---|---|
| Open | Heyman Blake L | $103,000 |
Source: Public Records
Tax History Compared to Growth
Tax History
| Year | Tax Paid | Tax Assessment Tax Assessment Total Assessment is a certain percentage of the fair market value that is determined by local assessors to be the total taxable value of land and additions on the property. | Land | Improvement |
|---|---|---|---|---|
| 2024 | $1,819 | $43,410 | $8,390 | $35,020 |
| 2023 | $1,819 | $37,330 | $6,030 | $31,300 |
| 2022 | $1,674 | $37,330 | $6,030 | $31,300 |
| 2021 | $1,687 | $37,330 | $6,030 | $31,300 |
| 2020 | $1,560 | $32,860 | $6,030 | $26,830 |
| 2019 | $1,535 | $32,860 | $6,030 | $26,830 |
| 2018 | $1,551 | $32,860 | $6,030 | $26,830 |
| 2017 | $1,182 | $26,210 | $6,030 | $20,180 |
| 2016 | $1,147 | $26,210 | $6,030 | $20,180 |
| 2015 | $1,172 | $26,230 | $6,040 | $20,190 |
| 2014 | $1,253 | $26,920 | $6,720 | $20,200 |
| 2013 | $1,251 | $26,920 | $6,720 | $20,200 |
Source: Public Records
Map
Nearby Homes
- 3050 E Main St
- 817 E Main St
- 140 Harkness St
- 140 Hobson St
- 501 E Center St
- 808 Castalia St
- 819 Castalia St
- 124 Sunset Dr
- 130 Huffman St
- 206 Southwest St
- 219 Huffman St
- 126 Greenwood Heights
- 408 W Main St
- 129 Hamilton St
- 111 Park Ave
- 154 Ashford Ave
- 155 Ashford Ave
- 231 Lawrence St
- 118 Maplewood
- 230 Highland Ave Unit 106
- 5617 Edmonds Rd
- 5605 Edmonds Rd
- 5631 Edmonds Rd
- 5591 Edmonds Rd
- 5569 Edmonds Rd
- 5557 Edmonds Rd
- 5566 State Route 113
- 5560 State Route 113
- 5588 State Route 113
- 5691 Edmonds Rd
- 5550 State Route 113
- 5549 Billings Rd
- 5077 Billings Rd
- 5077 Billings Rd
- 5516 State Route 113
- 5630 State Route 113
- 5583 State Route 113
- 5561 State Route 113
- 5074 Billings Rd
- 5640 State Route 113