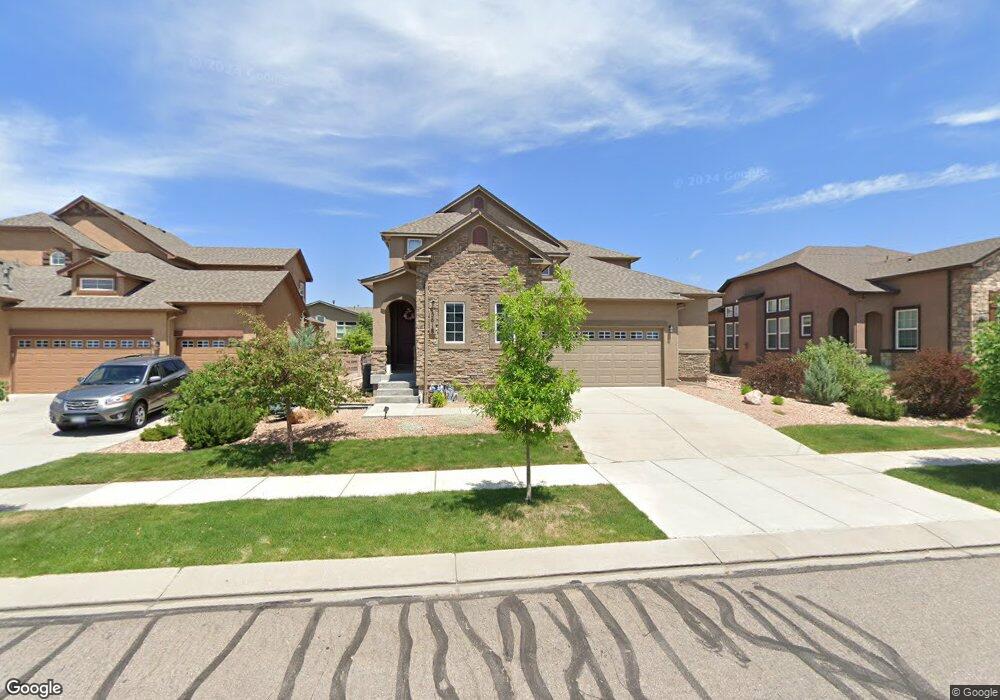
5618 Cisco Dr Colorado Springs, CO 80924
Wolf Ranch NeighborhoodEstimated Value: $707,767 - $747,000
5
Beds
4
Baths
4,041
Sq Ft
$180/Sq Ft
Est. Value
About This Home
This home is located at 5618 Cisco Dr, Colorado Springs, CO 80924 and is currently estimated at $727,692, approximately $180 per square foot. 5618 Cisco Dr is a home located in El Paso County with nearby schools including Ranch Creek Elementary School, Chinook Trail Middle School, and Liberty High School.
Ownership History
Date
Name
Owned For
Owner Type
Purchase Details
Closed on
Dec 22, 2017
Sold by
Bender Karl and Bender Jesika
Bought by
Snyder Mike and Snyder Angela
Current Estimated Value
Home Financials for this Owner
Home Financials are based on the most recent Mortgage that was taken out on this home.
Original Mortgage
$460,098
Outstanding Balance
$387,162
Interest Rate
3.92%
Mortgage Type
VA
Estimated Equity
$340,530
Purchase Details
Closed on
Apr 27, 2016
Sold by
Covington Homes Llc
Bought by
Bender Karl and Bender Jesika
Home Financials for this Owner
Home Financials are based on the most recent Mortgage that was taken out on this home.
Original Mortgage
$391,476
Interest Rate
3.73%
Mortgage Type
VA
Purchase Details
Closed on
Nov 11, 2015
Sold by
Villages At Wolf Ranch Llc
Bought by
Covington Homes Llc
Home Financials for this Owner
Home Financials are based on the most recent Mortgage that was taken out on this home.
Original Mortgage
$310,415
Interest Rate
3.9%
Mortgage Type
Construction
Create a Home Valuation Report for This Property
The Home Valuation Report is an in-depth analysis detailing your home's value as well as a comparison with similar homes in the area
Home Values in the Area
Average Home Value in this Area
Purchase History
| Date | Buyer | Sale Price | Title Company |
|---|---|---|---|
| Snyder Mike | $456,000 | Fidelity National Title | |
| Bender Karl | $391,476 | Land Title | |
| Covington Homes Llc | $81,120 | Land Title Guarantee |
Source: Public Records
Mortgage History
| Date | Status | Borrower | Loan Amount |
|---|---|---|---|
| Open | Snyder Mike | $460,098 | |
| Previous Owner | Bender Karl | $391,476 | |
| Previous Owner | Covington Homes Llc | $310,415 |
Source: Public Records
Tax History Compared to Growth
Tax History
| Year | Tax Paid | Tax Assessment Tax Assessment Total Assessment is a certain percentage of the fair market value that is determined by local assessors to be the total taxable value of land and additions on the property. | Land | Improvement |
|---|---|---|---|---|
| 2025 | $4,460 | $45,360 | -- | -- |
| 2024 | $3,668 | $43,550 | $8,040 | $35,510 |
| 2023 | $3,668 | $43,550 | $8,040 | $35,510 |
| 2022 | $3,176 | $35,310 | $7,390 | $27,920 |
| 2021 | $3,385 | $36,330 | $7,600 | $28,730 |
| 2020 | $4,142 | $34,090 | $6,610 | $27,480 |
| 2019 | $4,114 | $34,090 | $6,610 | $27,480 |
| 2018 | $3,228 | $26,520 | $5,880 | $20,640 |
| 2017 | $3,220 | $26,520 | $5,880 | $20,640 |
| 2016 | $1,018 | $8,680 | $6,400 | $2,280 |
| 2015 | $1,876 | $16,010 | $16,010 | $0 |
| 2014 | $1,321 | $11,270 | $11,270 | $0 |
Source: Public Records
Map
Nearby Homes
- 5654 Cisco Dr
- 8952 Tutt Blvd
- 5523 Sunrise Mesa Dr
- 5747 Wolf Village Dr
- 8775 Rose Grace Heights
- 8745 Rose Grace Heights
- 9033 Kennebec Pass Trail
- 9436 Wolf Valley Dr
- 9426 Wolf Valley Dr
- 9484 Simper Heights
- 5718 Paladin Place
- 5060 Mountain Vista Heights
- 5480 Leon Young Dr
- 8760 Eckberg Heights
- 5747 Leon Young Dr
- 8728 Eckberg Heights
- The Denali Plan at The Townes at Cumbre Vista
- The Elbrus Plan at The Townes at Cumbre Vista
- The Vinson Plan at The Townes at Cumbre Vista
- The Everest Plan at The Townes at Cumbre Vista
- 5630 Cisco Dr
- 5606 Cisco Dr
- 5642 Cisco Dr
- 5651 Wolf Village Dr
- 5659 Wolf Village Dr
- 5643 Wolf Village Dr
- 5619 Cisco Dr
- 5631 Cisco Dr
- 5667 Wolf Village Dr
- 5607 Cisco Dr
- 5643 Cisco Dr
- 5594 Cisco Dr
- 5675 Wolf Village Dr
- 5595 Wolf Village Dr
- 5666 Cisco Dr
- 5655 Cisco Dr
- 5595 Cisco Dr
- 5582 Cisco Dr
- 5683 Wolf Village Dr
- 5678 Cisco Dr