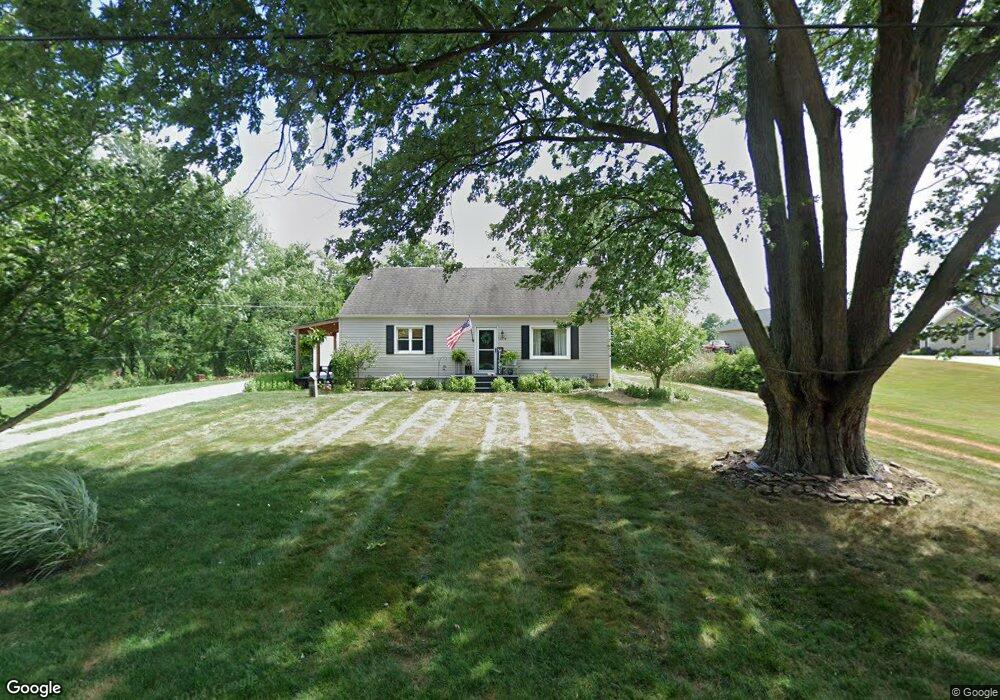
5618 Nimishillen Church Rd NE Canton, OH 44721
Estimated Value: $190,887 - $362,000
4
Beds
2
Baths
1,696
Sq Ft
$148/Sq Ft
Est. Value
About This Home
This home is located at 5618 Nimishillen Church Rd NE, Canton, OH 44721 and is currently estimated at $250,222, approximately $147 per square foot. 5618 Nimishillen Church Rd NE is a home located in Stark County with nearby schools including Marlington High School.
Ownership History
Date
Name
Owned For
Owner Type
Purchase Details
Closed on
Jan 20, 2012
Sold by
Residential Bancorp
Bought by
Yoder Matthew D and Rowland Melissa S
Current Estimated Value
Home Financials for this Owner
Home Financials are based on the most recent Mortgage that was taken out on this home.
Original Mortgage
$89,083
Outstanding Balance
$60,750
Interest Rate
3.87%
Mortgage Type
FHA
Estimated Equity
$189,472
Purchase Details
Closed on
Nov 22, 2010
Sold by
Barnes Bonnie L
Bought by
Residential Bancorp
Purchase Details
Closed on
Dec 14, 2007
Sold by
Werstler Hazel M and Werstler Denver D
Bought by
Barnes Bonnie L
Home Financials for this Owner
Home Financials are based on the most recent Mortgage that was taken out on this home.
Original Mortgage
$120,000
Interest Rate
6.31%
Mortgage Type
Purchase Money Mortgage
Create a Home Valuation Report for This Property
The Home Valuation Report is an in-depth analysis detailing your home's value as well as a comparison with similar homes in the area
Home Values in the Area
Average Home Value in this Area
Purchase History
| Date | Buyer | Sale Price | Title Company |
|---|---|---|---|
| Yoder Matthew D | $91,400 | None Available | |
| Residential Bancorp | $120,000 | Attorney | |
| Barnes Bonnie L | $83,500 | None Available |
Source: Public Records
Mortgage History
| Date | Status | Borrower | Loan Amount |
|---|---|---|---|
| Open | Yoder Matthew D | $89,083 | |
| Previous Owner | Barnes Bonnie L | $120,000 |
Source: Public Records
Tax History Compared to Growth
Tax History
| Year | Tax Paid | Tax Assessment Tax Assessment Total Assessment is a certain percentage of the fair market value that is determined by local assessors to be the total taxable value of land and additions on the property. | Land | Improvement |
|---|---|---|---|---|
| 2025 | -- | $64,970 | $10,820 | $54,150 |
| 2024 | -- | $44,740 | $10,820 | $33,920 |
| 2023 | $1,533 | $41,690 | $8,720 | $32,970 |
| 2022 | $1,516 | $41,100 | $8,720 | $32,380 |
| 2021 | $1,522 | $41,100 | $8,720 | $32,380 |
| 2020 | $1,356 | $33,570 | $7,320 | $26,250 |
| 2019 | $1,346 | $33,570 | $7,320 | $26,250 |
| 2018 | $1,285 | $33,570 | $7,320 | $26,250 |
| 2017 | $1,241 | $30,000 | $6,370 | $23,630 |
| 2016 | $1,242 | $30,000 | $6,370 | $23,630 |
| 2015 | $1,244 | $30,000 | $6,370 | $23,630 |
| 2014 | $1,174 | $26,190 | $5,570 | $20,620 |
| 2013 | $574 | $26,190 | $5,570 | $20,620 |
Source: Public Records
Map
Nearby Homes
- 0 Hunting Hills Ave NE
- 10299 Hunting Hills Ave NE
- 6180 Edison St NE
- 3990 Edison St NE
- 2793 Rita St NE
- 10277 Carlswood Ave NE
- 12561 Duquette Ave NE
- 1975 Eloise Cir NE
- 1180 Tessa Trail Unit 1180
- 545 E Maple St
- 2084 Hazel St NE
- 11121 Geib Ave NE
- 3681 Werner Church Rd NE
- 2231 Lovers Ln NE
- 425 Tonawanda Trail SW
- 3404 Wicker St NE
- 223 E Maple St
- 7875 Bentler Ave NE
- 225 Seneca Trail SW
- Elder Plan at Sparwood Farms
- 5611 Nimishillen Church Rd NE
- 5585 Nimishillen Church Rd NE
- 5582 Nimishillen Church Rd NE
- 5565 Nimishillen Church Rd NE
- 5700 Nimishillen Church Rd NE
- 5711 Nimishillen Church Rd NE
- 5677 Nimishillen Church Rd NE
- 5735 Nimishillen Church Rd NE
- 5743 Nimishillen Church Rd NE
- 5767 Nimishillen Church Rd NE
- 5773 Nimishillen Church Rd NE
- 5556 Meadowcreek Cir NE
- 5790 Nimishillen Church Rd NE
- 11120 Miller Ave NE
- 11120 Miller Ave NE
- 5835 Nimishillen Church Rd NE
- 5561 Meadowcreek Cir NE
- 5542 Meadowcreek Cir NE
- 11156 Miller Ave NE
- 5561 Meadow Creek Cir