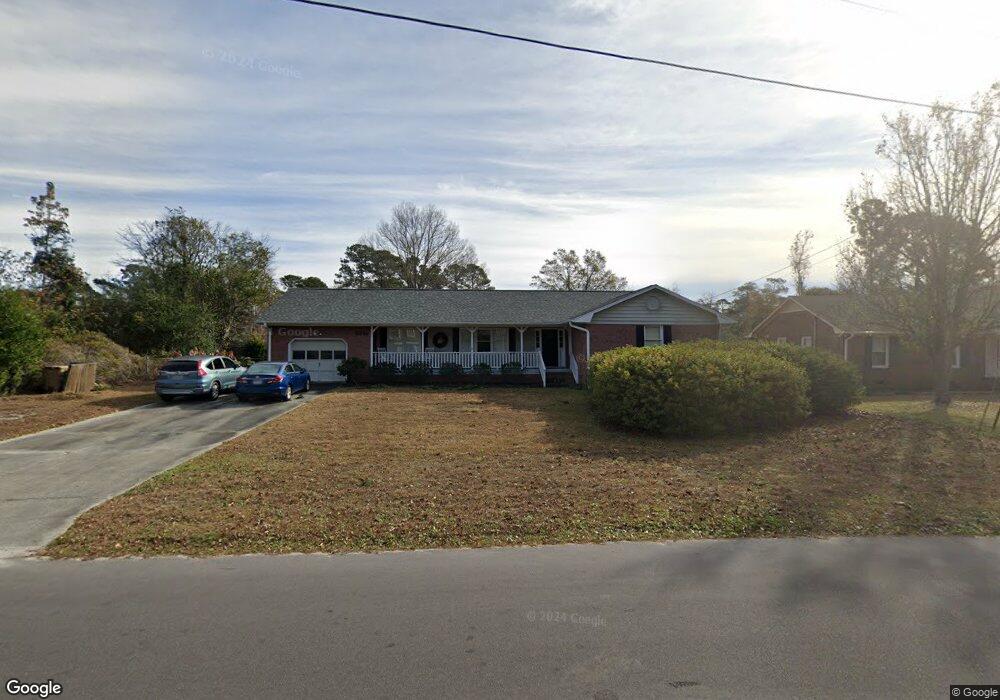
5619 Woodduck Cir Wilmington, NC 28409
Estimated Value: $440,725 - $460,000
3
Beds
2
Baths
2,029
Sq Ft
$220/Sq Ft
Est. Value
About This Home
This home is located at 5619 Woodduck Cir, Wilmington, NC 28409 and is currently estimated at $446,431, approximately $220 per square foot. 5619 Woodduck Cir is a home located in New Hanover County with nearby schools including Heyward C. Bellamy Elementary School, Myrtle Grove Middle School, and Eugene Ashley High School.
Ownership History
Date
Name
Owned For
Owner Type
Purchase Details
Closed on
Jul 30, 2025
Sold by
Krueger Patricia A
Bought by
Patricia A Krueger Revocable Living Trust and Krueger
Current Estimated Value
Purchase Details
Closed on
Jun 15, 2004
Sold by
Bailey Wayne D Donna A
Bought by
Krueger Scott Patricia A
Purchase Details
Closed on
Aug 11, 1995
Sold by
Reiter Robert E Jr Grace H
Bought by
Bailey Wayne D Donna A
Purchase Details
Closed on
Apr 27, 1989
Sold by
Walsh Richard H Christine
Bought by
Reiter Robert E Jr Grace H
Purchase Details
Closed on
Aug 1, 1983
Sold by
Howell Charles R Jr Judith
Bought by
Walsh Richard H Christine
Purchase Details
Closed on
Oct 1, 1982
Sold by
Emmart Maurice S Jr Wm T
Bought by
Howell Charles R Jr Judith
Purchase Details
Closed on
Mar 1, 1981
Bought by
Emmart Maurice S Jr Wm T
Create a Home Valuation Report for This Property
The Home Valuation Report is an in-depth analysis detailing your home's value as well as a comparison with similar homes in the area
Home Values in the Area
Average Home Value in this Area
Purchase History
| Date | Buyer | Sale Price | Title Company |
|---|---|---|---|
| Patricia A Krueger Revocable Living Trust | -- | None Listed On Document | |
| Patricia A Krueger Revocable Living Trust | -- | None Listed On Document | |
| Krueger Scott Patricia A | $165,500 | -- | |
| Bailey Wayne D Donna A | $126,000 | -- | |
| Reiter Robert E Jr Grace H | $97,000 | -- | |
| Walsh Richard H Christine | $81,000 | -- | |
| Howell Charles R Jr Judith | $4,000 | -- | |
| Emmart Maurice S Jr Wm T | -- | -- |
Source: Public Records
Tax History Compared to Growth
Tax History
| Year | Tax Paid | Tax Assessment Tax Assessment Total Assessment is a certain percentage of the fair market value that is determined by local assessors to be the total taxable value of land and additions on the property. | Land | Improvement |
|---|---|---|---|---|
| 2025 | $1,517 | $477,800 | $130,600 | $347,200 |
| 2024 | $1,517 | $276,200 | $82,900 | $193,300 |
| 2023 | $1,517 | $276,200 | $82,900 | $193,300 |
| 2022 | $1,525 | $276,200 | $82,900 | $193,300 |
| 2021 | $1,524 | $276,200 | $82,900 | $193,300 |
| 2020 | $1,402 | $221,600 | $55,000 | $166,600 |
| 2019 | $1,402 | $221,600 | $55,000 | $166,600 |
| 2018 | $1,402 | $221,600 | $55,000 | $166,600 |
| 2017 | $1,435 | $221,600 | $55,000 | $166,600 |
| 2016 | $1,240 | $178,900 | $55,000 | $123,900 |
| 2015 | $1,152 | $178,900 | $55,000 | $123,900 |
| 2014 | $1,132 | $178,900 | $55,000 | $123,900 |
Source: Public Records
Map
Nearby Homes
- 5705 Woodduck Cir
- 301 Foxwood Ln
- 273 Foxwood Ln
- 5500 N Warrendale Ct
- 5004 Laurenbridge Ln
- 4922 Woods Edge Rd
- 5028 Laurenbridge Ln
- 633 Piner Rd
- 234 Brighton Rd
- 653 Hidden Valley Rd
- 4817 Wedgefield Dr
- 4829 Wedgefield Dr
- 1202 Beresford Ct
- 5200 Woods Edge Rd
- 4914 Northeaster Dr
- 4804 S College Rd Unit 36
- 4804 S College Rd Unit 50
- 5014 Helms Port Ave
- 5900 Offshore Ct
- 5103 Long Pointe Rd
- 5623 Woodduck Cir
- 5615 Woodduck Cir
- 5615 Wood Duck Cir
- 725 Emmarts Ct
- 5627 Woodduck Cir
- 712 Grey Squirrel Dr
- 5622 Wood Duck Cir
- 5618 Woodduck Cir
- 717 Grey Squirrel Dr
- 5622 Woodduck Cir
- 5611 Woodduck Cir
- 5614 Woodduck Cir
- 5626 Woodduck Cir
- 5631 Woodduck Cir
- 730 Emmarts Ct
- 721 Emmarts Ct
- 708 Grey Squirrel Dr
- 5610 Woodduck Cir
- 5607 Wood Duck Cir
- 5607 Woodduck Cir