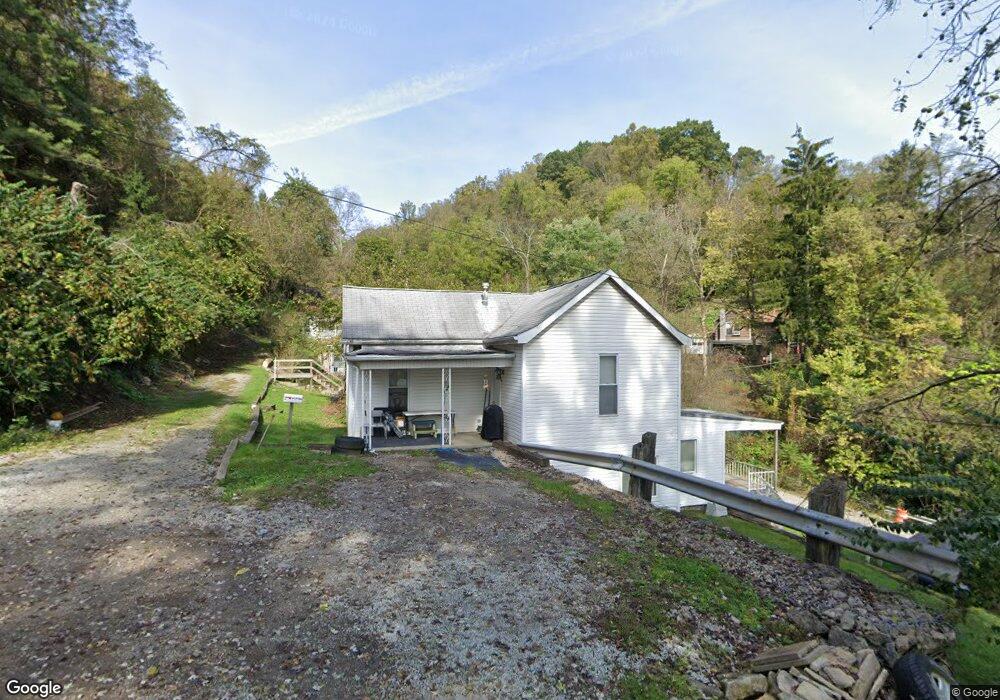
562 N 8th St Martins Ferry, OH 43935
Estimated Value: $41,049 - $78,000
2
Beds
1
Bath
889
Sq Ft
$69/Sq Ft
Est. Value
About This Home
This home is located at 562 N 8th St, Martins Ferry, OH 43935 and is currently estimated at $61,262, approximately $68 per square foot. 562 N 8th St is a home located in Belmont County with nearby schools including Anna Marie Ayers Elementary School, Martins Ferry Middle School, and Martins Ferry High School.
Ownership History
Date
Name
Owned For
Owner Type
Purchase Details
Closed on
Jun 18, 2008
Sold by
Mcconnaughy John J
Bought by
Linzy Denver E
Current Estimated Value
Purchase Details
Closed on
Jan 21, 2003
Sold by
Mcconnaughy John J
Bought by
Mcconnaughy John J
Purchase Details
Closed on
May 30, 2000
Sold by
Gray Kimberly and Su Terry
Bought by
Gray Kimberly and Terry Su
Purchase Details
Closed on
Jul 12, 1999
Sold by
Mcconnaughy Shirley Ann
Bought by
Mcconnaughy Shirley Ann
Purchase Details
Closed on
Jan 1, 1986
Sold by
Diehl Deborah K
Bought by
Diehl Deborah K
Create a Home Valuation Report for This Property
The Home Valuation Report is an in-depth analysis detailing your home's value as well as a comparison with similar homes in the area
Home Values in the Area
Average Home Value in this Area
Purchase History
| Date | Buyer | Sale Price | Title Company |
|---|---|---|---|
| Linzy Denver E | $13,000 | Attorney | |
| Mcconnaughy John J | -- | -- | |
| Gray Kimberly | -- | -- | |
| Mcconnaughy Shirley Ann | $3,000 | -- | |
| Diehl Deborah K | -- | -- |
Source: Public Records
Tax History Compared to Growth
Tax History
| Year | Tax Paid | Tax Assessment Tax Assessment Total Assessment is a certain percentage of the fair market value that is determined by local assessors to be the total taxable value of land and additions on the property. | Land | Improvement |
|---|---|---|---|---|
| 2024 | $343 | $1,870 | $1,370 | $500 |
| 2023 | $968 | $6,400 | $1,130 | $5,270 |
| 2022 | $999 | $6,401 | $1,127 | $5,274 |
| 2021 | $1,832 | $6,401 | $1,127 | $5,274 |
| 2020 | $1,039 | $5,570 | $980 | $4,590 |
| 2019 | $457 | $5,570 | $980 | $4,590 |
| 2018 | $238 | $5,570 | $980 | $4,590 |
| 2017 | $212 | $4,290 | $600 | $3,690 |
| 2016 | $217 | $4,290 | $600 | $3,690 |
| 2015 | $366 | $4,290 | $600 | $3,690 |
| 2014 | $477 | $5,470 | $550 | $4,920 |
| 2013 | $549 | $5,470 | $550 | $4,920 |
Source: Public Records
Map
Nearby Homes