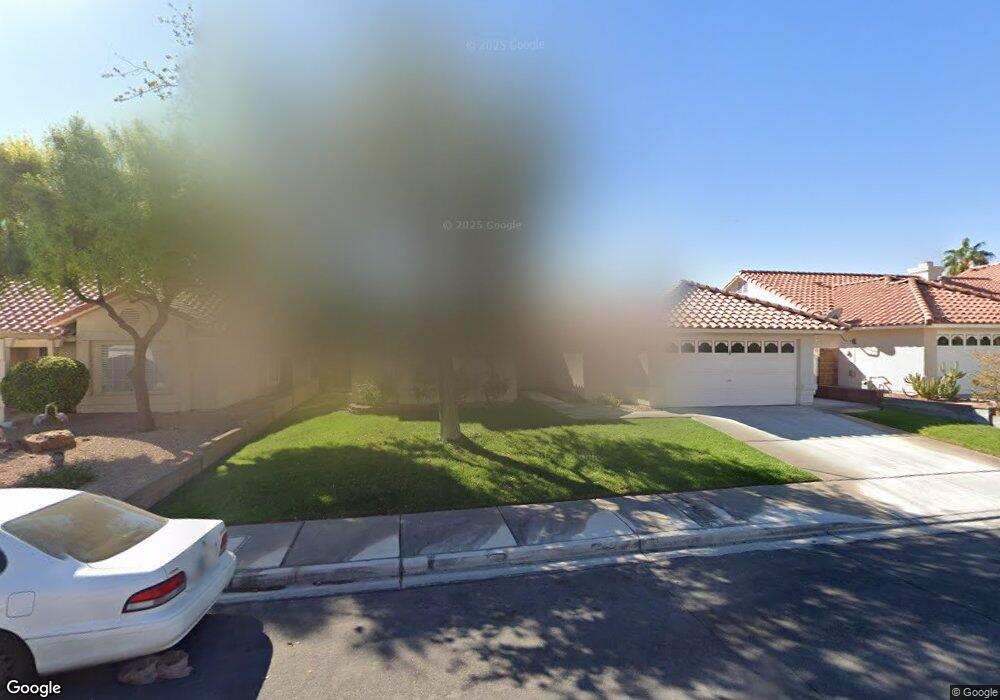
5621 Crimson Ridge Dr Las Vegas, NV 89130
North Cheyenne NeighborhoodEstimated Value: $419,000 - $434,044
3
Beds
2
Baths
1,489
Sq Ft
$285/Sq Ft
Est. Value
About This Home
This home is located at 5621 Crimson Ridge Dr, Las Vegas, NV 89130 and is currently estimated at $424,761, approximately $285 per square foot. 5621 Crimson Ridge Dr is a home located in Clark County with nearby schools including Ernest May Elementary School, Theron L Swainston Middle School, and Cheyenne High School.
Ownership History
Date
Name
Owned For
Owner Type
Purchase Details
Closed on
Sep 17, 2009
Sold by
Nyulassy Rosalind
Bought by
Nyulassy Rosalind D and The Rosalind D Nyulassy Revocable Trust
Current Estimated Value
Purchase Details
Closed on
Aug 4, 2009
Sold by
Nyulassy Rosalind
Bought by
Nyulassy Rosalind D and The Rosalind D Nyulassy Revocable Trust
Purchase Details
Closed on
May 11, 2009
Sold by
Rosalind Nyulassy Family Trust
Bought by
Nyulassy Rosalind D and The Rosalind D Nyulassy Revocable Trust
Purchase Details
Closed on
Jan 6, 2006
Sold by
Marcks Lynda L
Bought by
Nyulassy Rosalind and Nyulassy Family Trust
Purchase Details
Closed on
Sep 30, 2002
Sold by
Campos Orlando B and Campos Angela A
Bought by
Marcks Lynda L
Home Financials for this Owner
Home Financials are based on the most recent Mortgage that was taken out on this home.
Original Mortgage
$110,250
Interest Rate
6.22%
Create a Home Valuation Report for This Property
The Home Valuation Report is an in-depth analysis detailing your home's value as well as a comparison with similar homes in the area
Home Values in the Area
Average Home Value in this Area
Purchase History
| Date | Buyer | Sale Price | Title Company |
|---|---|---|---|
| Nyulassy Rosalind D | -- | None Available | |
| Nyulassy Rosalind D | -- | None Available | |
| Nyulassy Rosalind D | -- | None Available | |
| Nyulassy Rosalind | $290,000 | Fidelity National Title | |
| Marcks Lynda L | $147,000 | Pioneer National Title |
Source: Public Records
Mortgage History
| Date | Status | Borrower | Loan Amount |
|---|---|---|---|
| Previous Owner | Marcks Lynda L | $110,250 |
Source: Public Records
Tax History Compared to Growth
Tax History
| Year | Tax Paid | Tax Assessment Tax Assessment Total Assessment is a certain percentage of the fair market value that is determined by local assessors to be the total taxable value of land and additions on the property. | Land | Improvement |
|---|---|---|---|---|
| 2025 | $1,804 | $97,319 | $34,650 | $62,669 |
| 2024 | $1,752 | $97,319 | $34,650 | $62,669 |
| 2023 | $1,752 | $91,679 | $32,200 | $59,479 |
| 2022 | $1,701 | $81,554 | $26,600 | $54,954 |
| 2021 | $1,652 | $75,880 | $23,450 | $52,430 |
| 2020 | $1,601 | $74,705 | $22,400 | $52,305 |
| 2019 | $1,554 | $71,405 | $19,600 | $51,805 |
| 2018 | $1,509 | $66,264 | $16,100 | $50,164 |
| 2017 | $2,147 | $65,484 | $14,350 | $51,134 |
| 2016 | $1,430 | $61,890 | $10,500 | $51,390 |
| 2015 | $1,426 | $53,152 | $8,750 | $44,402 |
| 2014 | $1,384 | $44,464 | $7,000 | $37,464 |
Source: Public Records
Map
Nearby Homes
- 5812 Ventana Dr
- 5900 Red Umber Ave
- 4801 Fiesta Lakes St
- 4821 Fiesta Lakes St
- 4808 Fiesta Lakes St
- 4816 Fiesta Lakes St
- 4833 Fiesta Lakes St
- 6105 Sadler Dr
- 4905 Ocean Shores Way
- 5605 Bay Shore Cir
- 4817 Friar Ln
- 4708 Royal Sunset Ct
- 5213 Red Glory Dr
- 5213 Tamanar Dr
- 5309 Camino Del Rancho
- 4521 Night Dance Ct
- 5004 Rancho Bernardo Way
- 4401 Inez Dr
- 5600 Segolilly Cir
- 4852 Maryvale Dr
- 5617 Crimson Ridge Dr
- 5625 Crimson Ridge Dr
- 5620 Via Del Viento Ave Unit 2
- 5616 Via Del Viento Ave
- 5613 Crimson Ridge Dr
- 5629 Crimson Ridge Dr
- 5612 Via Del Viento Ave
- 4625 Mancilla St
- 5620 Crimson Ridge Dr
- 5616 Crimson Ridge Dr
- 5624 Crimson Ridge Dr
- 5609 Crimson Ridge Dr
- 5608 Via Del Viento Ave Unit 2
- 4621 Mancilla St
- 5608 Crimson Ridge Dr
- 5604 Via Del Viento Ave
- 5605 Crimson Ridge Dr
- 5701 Crimson Ridge Dr
- 5621 Red Bluff Dr
- 5617 Via Del Viento Ave