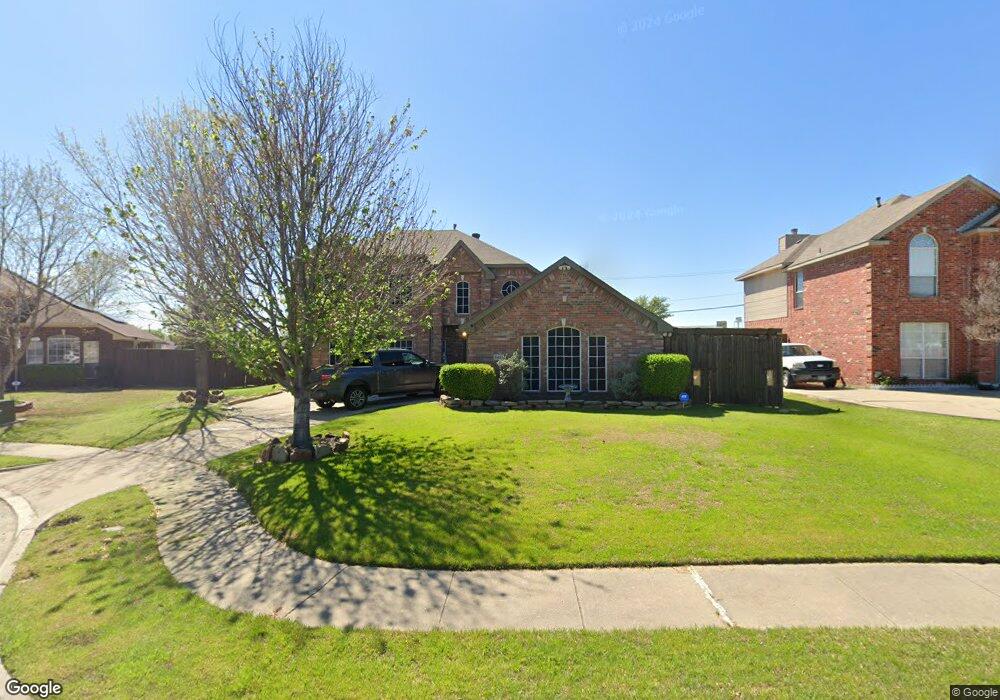
5621 Mandarin Ln Sachse, TX 75048
Estimated Value: $390,830 - $442,000
4
Beds
3
Baths
2,275
Sq Ft
$181/Sq Ft
Est. Value
About This Home
This home is located at 5621 Mandarin Ln, Sachse, TX 75048 and is currently estimated at $412,458, approximately $181 per square foot. 5621 Mandarin Ln is a home located in Dallas County with nearby schools including Pinnacle Montessori of Sachse and Firewheel Christian Academy.
Ownership History
Date
Name
Owned For
Owner Type
Purchase Details
Closed on
Nov 19, 2004
Sold by
Carter William and Carter Janine
Bought by
Woodward Teresa L
Current Estimated Value
Home Financials for this Owner
Home Financials are based on the most recent Mortgage that was taken out on this home.
Original Mortgage
$120,480
Outstanding Balance
$64,357
Interest Rate
6.85%
Mortgage Type
Purchase Money Mortgage
Estimated Equity
$348,101
Purchase Details
Closed on
Mar 15, 2002
Sold by
Sumeer Homes Inc
Bought by
Carter William and Carter Janine
Home Financials for this Owner
Home Financials are based on the most recent Mortgage that was taken out on this home.
Original Mortgage
$134,291
Interest Rate
10.37%
Purchase Details
Closed on
Oct 18, 2000
Sold by
Rbr Properties Inc
Bought by
Sumeer Homes Inc
Home Financials for this Owner
Home Financials are based on the most recent Mortgage that was taken out on this home.
Original Mortgage
$482,650
Interest Rate
7.89%
Create a Home Valuation Report for This Property
The Home Valuation Report is an in-depth analysis detailing your home's value as well as a comparison with similar homes in the area
Home Values in the Area
Average Home Value in this Area
Purchase History
| Date | Buyer | Sale Price | Title Company |
|---|---|---|---|
| Woodward Teresa L | -- | Rtt | |
| Carter William | -- | -- | |
| Sumeer Homes Inc | -- | -- |
Source: Public Records
Mortgage History
| Date | Status | Borrower | Loan Amount |
|---|---|---|---|
| Open | Woodward Teresa L | $120,480 | |
| Previous Owner | Carter William | $134,291 | |
| Previous Owner | Sumeer Homes Inc | $482,650 | |
| Closed | Carter William | $15,799 | |
| Closed | Woodward Teresa L | $30,120 |
Source: Public Records
Tax History Compared to Growth
Tax History
| Year | Tax Paid | Tax Assessment Tax Assessment Total Assessment is a certain percentage of the fair market value that is determined by local assessors to be the total taxable value of land and additions on the property. | Land | Improvement |
|---|---|---|---|---|
| 2025 | $5,876 | $385,900 | $90,000 | $295,900 |
| 2024 | $5,876 | $385,900 | $90,000 | $295,900 |
| 2023 | $5,876 | $339,460 | $64,000 | $275,460 |
| 2022 | $8,122 | $339,460 | $64,000 | $275,460 |
| 2021 | $6,295 | $244,590 | $46,000 | $198,590 |
| 2020 | $6,399 | $244,590 | $46,000 | $198,590 |
| 2019 | $6,938 | $244,590 | $46,000 | $198,590 |
| 2018 | $6,693 | $233,690 | $41,000 | $192,690 |
| 2017 | $6,712 | $233,690 | $41,000 | $192,690 |
| 2016 | $5,730 | $199,530 | $41,000 | $158,530 |
| 2015 | $3,674 | $151,160 | $35,000 | $116,160 |
| 2014 | $3,674 | $151,160 | $35,000 | $116,160 |
Source: Public Records
Map
Nearby Homes
- 3910 7th St
- 3917 Lillie St
- 3711 7th St
- 4807 Sachse Rd
- 4007 William St
- 3320 Salmon St
- 3324 Salmon St
- 3818 Missouri St
- 3320 Bryan St
- 3408 Lillie St
- 5159 Willow Bend Ln
- 5937 Boone St
- 5824 Boone St
- 5111 Live Oak Dr
- 4924 Westcreek Ln
- 4912 Williford Rd
- 4819 Jackson Meadows Dr
- 5014 Brookhollow Dr
- 3117 Tina St
- 4818 Westcreek Ln
- 5707 Mandarin Ln
- 4303 Mallard Ln
- 5711 Mandarin Ln
- 4308 Mallard Ln
- 4307 Mallard Ln
- 4311 Mallard Ln
- 4312 Mallard Ln
- 5715 Mandarin Ln
- 4307 Canvasback Ln
- 4311 Canvasback Ln
- 4315 Mallard Ln
- 4316 Mallard Ln
- 5721 Mandarin Ln
- 4411 Sachse Rd
- 4315 Canvasback Ln
- 4321 Mallard Ln
- 4320 Mallard Ln
- 5807 Mandarin Ln
- 4321 Canvasback Ln
- 5812 Mandarin Ln