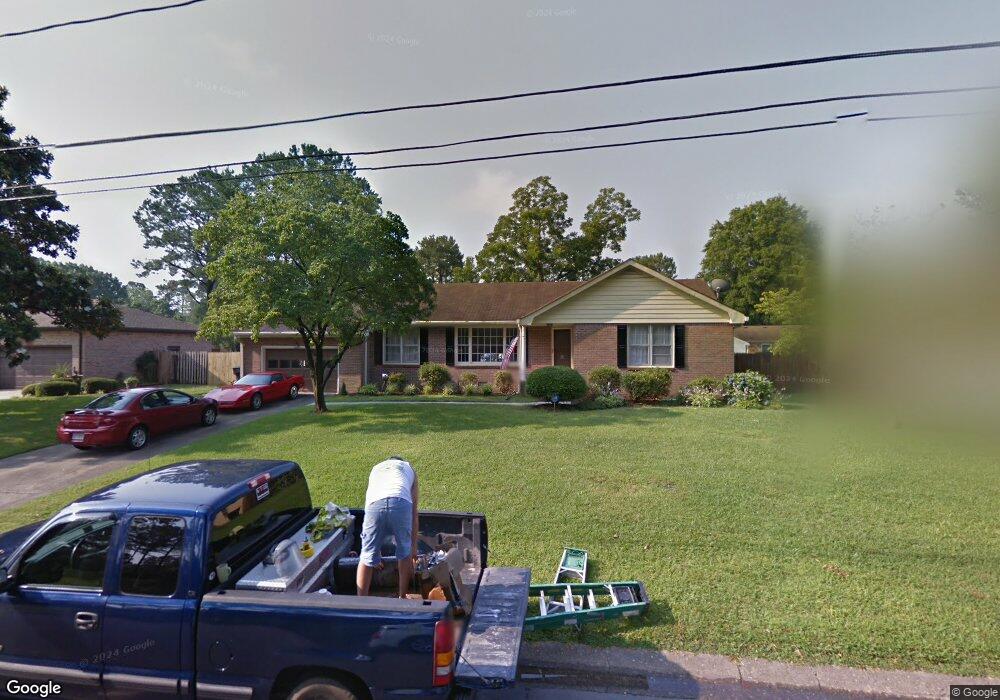
5621 Springwood Dr Portsmouth, VA 23703
Churchland NeighborhoodEstimated Value: $351,000 - $380,091
4
Beds
3
Baths
1,898
Sq Ft
$193/Sq Ft
Est. Value
About This Home
This home is located at 5621 Springwood Dr, Portsmouth, VA 23703 and is currently estimated at $366,023, approximately $192 per square foot. 5621 Springwood Dr is a home located in Portsmouth City with nearby schools including Churchland Elementary School, Churchland Academy Elementary School, and Churchland Middle School.
Ownership History
Date
Name
Owned For
Owner Type
Purchase Details
Closed on
Jul 26, 2018
Sold by
Crawford Jeffery A
Bought by
Faulks Tywana
Current Estimated Value
Home Financials for this Owner
Home Financials are based on the most recent Mortgage that was taken out on this home.
Original Mortgage
$192,985
Outstanding Balance
$166,900
Interest Rate
4.5%
Mortgage Type
FHA
Estimated Equity
$199,123
Purchase Details
Closed on
Jan 4, 2012
Sold by
Federal National Mortgage Association
Bought by
Crawford Jeffery A
Home Financials for this Owner
Home Financials are based on the most recent Mortgage that was taken out on this home.
Original Mortgage
$167,912
Interest Rate
3.75%
Mortgage Type
FHA
Purchase Details
Closed on
Oct 24, 2011
Sold by
Professional Foreclosure Corp and Yost Ii Ralph R
Bought by
Federal National Mtg Asoc
Create a Home Valuation Report for This Property
The Home Valuation Report is an in-depth analysis detailing your home's value as well as a comparison with similar homes in the area
Home Values in the Area
Average Home Value in this Area
Purchase History
| Date | Buyer | Sale Price | Title Company |
|---|---|---|---|
| Faulks Tywana | $196,546 | Attorney | |
| Crawford Jeffery A | $175,000 | -- | |
| Federal National Mtg Asoc | $261,016 | -- |
Source: Public Records
Mortgage History
| Date | Status | Borrower | Loan Amount |
|---|---|---|---|
| Open | Faulks Tywana | $192,985 | |
| Previous Owner | Crawford Jeffery A | $167,912 |
Source: Public Records
Tax History Compared to Growth
Tax History
| Year | Tax Paid | Tax Assessment Tax Assessment Total Assessment is a certain percentage of the fair market value that is determined by local assessors to be the total taxable value of land and additions on the property. | Land | Improvement |
|---|---|---|---|---|
| 2025 | $4,044 | $316,690 | $97,200 | $219,490 |
| 2024 | $4,044 | $314,910 | $97,200 | $217,710 |
| 2023 | $3,670 | $293,580 | $97,200 | $196,380 |
| 2022 | $3,722 | $286,270 | $81,000 | $205,270 |
| 2021 | $3,006 | $231,230 | $65,070 | $166,160 |
| 2020 | $2,966 | $228,130 | $61,970 | $166,160 |
| 2019 | $2,932 | $225,510 | $61,970 | $163,540 |
| 2018 | $2,932 | $225,510 | $61,970 | $163,540 |
| 2017 | $2,932 | $225,510 | $61,970 | $163,540 |
| 2016 | $2,932 | $225,510 | $61,970 | $163,540 |
| 2015 | $2,839 | $218,400 | $61,970 | $156,430 |
| 2014 | $2,774 | $218,400 | $61,970 | $156,430 |
Source: Public Records
Map
Nearby Homes
- 3315 Camellia Dr
- 5516 Bingham Dr
- 3432 Carter Rd
- 3509 Spence Rd
- 4959 Briarwood Ln
- 4955 Briarwood Ln
- 5304 High St W
- 5302 High St W
- 5220 Clover Hill Dr
- 3604 Lilac Dr
- 10AC Cedar Ln
- 3425 Cedar Ln
- 3101 Laurel Ln
- 5300 Larkspur Rd
- 5221 High St W
- 3110 Sterling Way Unit 62
- 3233 Clover Hill Dr
- 3205 Clover Hill Dr
- 3405 Canterbury Dr
- 3200 Westwood Crescent
- 5617 Springwood Dr
- 5625 Springwood Dr
- 5620 Greenefield Dr N
- 5616 Greenefield Dr N
- 5624 Greenefield Dr N
- 5620 Springwood Dr
- 5613 Springwood Dr
- 5629 Springwood Dr
- 5616 Springwood Dr
- 5612 Greenefield Dr N
- 5628 Greenefield Dr N
- 5628 Springwood Dr
- 3529 Marlyn Rd
- 5609 Springwood Dr
- 3605 Sagewood Dr
- 3541 Carter Rd
- 3604 Brookwood Dr
- 3524 Marlyn Rd
- 3537 Carter Rd
- 5608 Greenefield Dr N