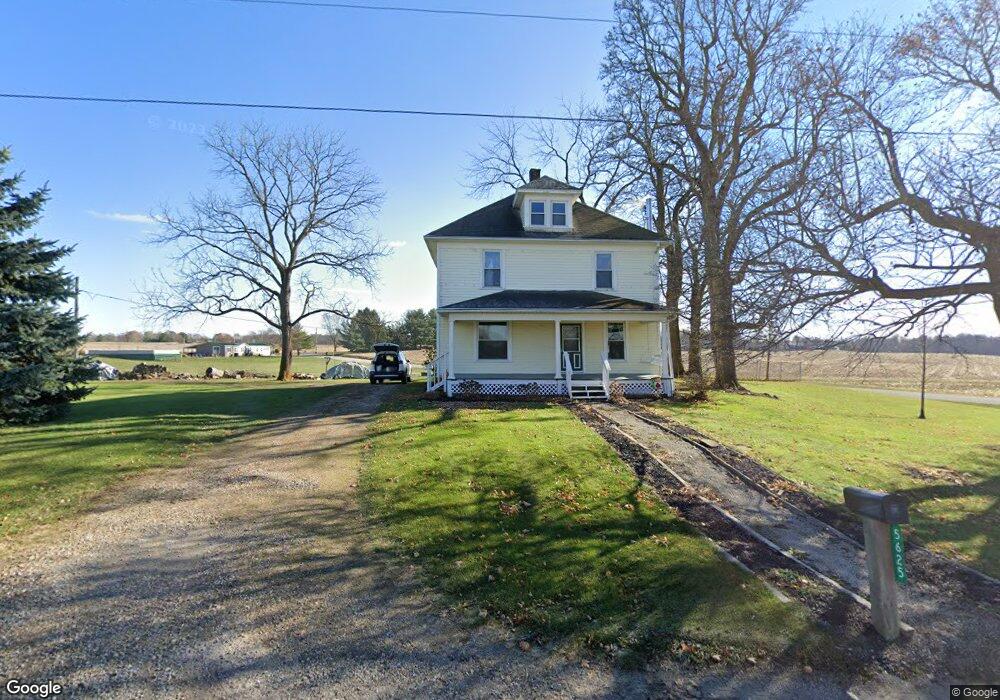
5625 U S 42 Unit 42 Mount Gilead, OH 43338
Estimated Value: $275,000 - $325,000
3
Beds
2
Baths
1,794
Sq Ft
$171/Sq Ft
Est. Value
About This Home
This home is located at 5625 U S 42 Unit 42, Mount Gilead, OH 43338 and is currently estimated at $307,157, approximately $171 per square foot. 5625 U S 42 Unit 42 is a home located in Morrow County with nearby schools including Park Avenue Elementary School, Mt Gilead Middle School, and Mt Gilead High School.
Ownership History
Date
Name
Owned For
Owner Type
Purchase Details
Closed on
Sep 27, 2013
Sold by
David L David L and Miller Erma F
Bought by
Foust Roger D
Current Estimated Value
Home Financials for this Owner
Home Financials are based on the most recent Mortgage that was taken out on this home.
Original Mortgage
$120,280
Outstanding Balance
$91,663
Interest Rate
4.87%
Mortgage Type
FHA
Estimated Equity
$215,494
Purchase Details
Closed on
Nov 29, 2011
Sold by
Zent Donald E and Zent Linda L
Bought by
Hershey Andrew J and Hershey Melissa A
Purchase Details
Closed on
Oct 14, 2008
Bought by
Miller David L and Miller Erma F
Purchase Details
Closed on
Jul 15, 2008
Sold by
Shadwick Gavin D and Shadwick Danna M
Bought by
Secretary Of Housing And Urban Developme
Purchase Details
Closed on
Feb 5, 2004
Sold by
Shadwick Gavin D
Bought by
Shadwick Gavin D and Shadwick Danna M
Purchase Details
Closed on
Jan 7, 2004
Sold by
King John D and King Joyce A
Bought by
Shadwick Gavin D
Purchase Details
Closed on
May 7, 1998
Sold by
Williams Thomas D And
Bought by
King John D and King Joyce A
Purchase Details
Closed on
Aug 5, 1991
Bought by
Williams Thomas D And
Create a Home Valuation Report for This Property
The Home Valuation Report is an in-depth analysis detailing your home's value as well as a comparison with similar homes in the area
Home Values in the Area
Average Home Value in this Area
Purchase History
| Date | Buyer | Sale Price | Title Company |
|---|---|---|---|
| Foust Roger D | $122,500 | -- | |
| Hershey Andrew J | -- | -- | |
| Miller David L | -- | -- | |
| Secretary Of Housing And Urban Developme | -- | -- | |
| Shadwick Gavin D | -- | -- | |
| Shadwick Gavin D | $145,700 | -- | |
| King John D | $110,000 | -- | |
| Williams Thomas D And | $73,900 | -- |
Source: Public Records
Mortgage History
| Date | Status | Borrower | Loan Amount |
|---|---|---|---|
| Open | Foust Roger D | $120,280 |
Source: Public Records
Tax History Compared to Growth
Tax History
| Year | Tax Paid | Tax Assessment Tax Assessment Total Assessment is a certain percentage of the fair market value that is determined by local assessors to be the total taxable value of land and additions on the property. | Land | Improvement |
|---|---|---|---|---|
| 2024 | $2,730 | $67,350 | $21,460 | $45,890 |
| 2023 | $2,730 | $67,350 | $21,460 | $45,890 |
| 2022 | $1,991 | $43,820 | $13,580 | $30,240 |
| 2021 | $1,888 | $43,820 | $13,580 | $30,240 |
| 2020 | $1,889 | $43,820 | $13,580 | $30,240 |
| 2019 | $1,682 | $38,790 | $12,010 | $26,780 |
| 2018 | $1,683 | $38,790 | $12,010 | $26,780 |
| 2017 | $1,653 | $38,790 | $12,010 | $26,780 |
| 2016 | $1,773 | $41,830 | $10,750 | $31,080 |
| 2015 | $1,662 | $41,830 | $10,750 | $31,080 |
| 2014 | $1,688 | $41,830 | $10,750 | $31,080 |
| 2013 | $1,679 | $44,040 | $11,310 | $32,730 |
Source: Public Records
Map
Nearby Homes
- 5545 County Road 240-Bryn Zion Rd
- 0 State Route 61 Unit 9066611
- VL Twp Rd 165
- 4681 County Road 101
- 6160 Congress St
- 7326 State Route 19 Unit 6 Lots 90 91 92
- 7326 State Route 19 Unit 1 Lots 62-63
- 5280 Township Road 103
- 5343 State Route 95
- 5953 County Road 109
- 0 Township Rd 114 Unit 9061639
- 7326 State Route 19 Unit 9 Lots 327-328
- 7326 State Route 19 Unit 9 Lots 256-257
- 5491 Township Road 14
- 5329 Township Road 115
- 5615 County Road 98
- 4350 Township Road 110
- 0 Township Road 110 Unit 6131011
- 165 Waldemar Ct Unit 8
- 7326 State Route 19 Unit 2 Lots 286-287
- 4989 St Rt 42
- 5625 Rt 42 St
- 5627 Rt 42 St
- 5637 N State Route 42
- 5637 U S 42
- 5394 County Road 93
- 5623 Rt 42 St
- 5650 Rt 42 St
- 5680 U S 42 Unit 42
- 5680 U S 42
- 5619 Rt 42 St
- 5680 Rt 42 St
- 5683 Rt 42 St
- 7326 St.Rt Unit 1 Lot 132 Candelwood Lake
- 5683 Us Highway 42
- 5619 U S 42 Unit 42
- 5545 County Road 240
- 5545 County Highway 240
- 5547 Township Road 108
- 0 County Road 240 Unit 221025210