Estimated Value: $380,000 - $430,000
5
Beds
2
Baths
1,850
Sq Ft
$218/Sq Ft
Est. Value
About This Home
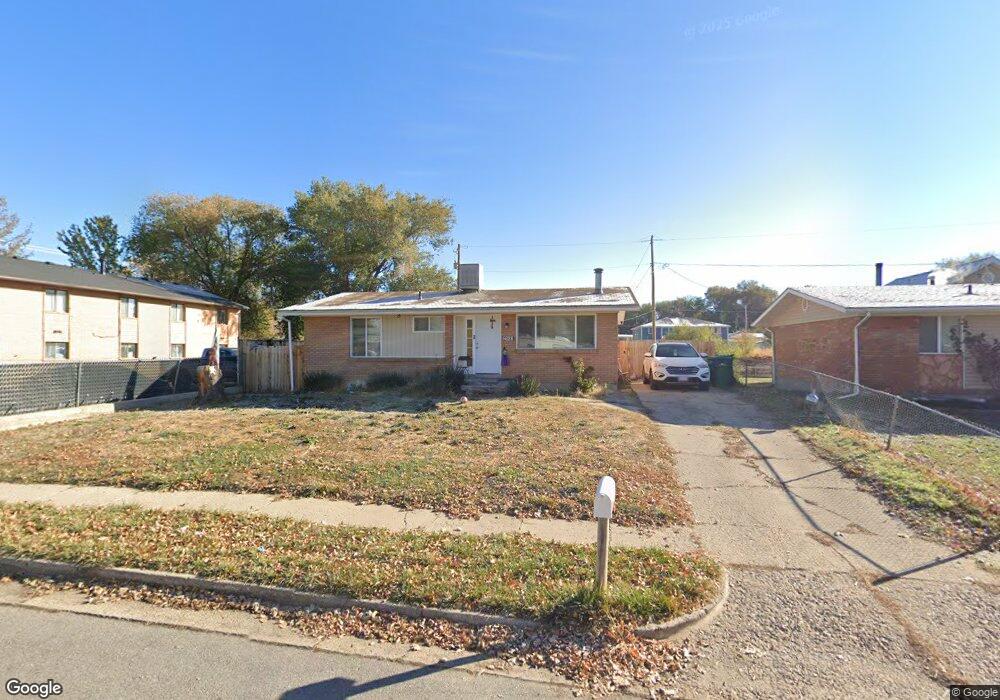
This home is located at 5628 S 2775 W, Roy, UT 84067 and is currently estimated at $403,463, approximately $218 per square foot. 5628 S 2775 W is a home located in Weber County with nearby schools including Roy Elementary School, Roy Junior High School, and Roy High School.
Ownership History
Date
Name
Owned For
Owner Type
Purchase Details
Closed on
Jul 7, 2021
Sold by
Bingham Brent T and Bingham Nina K
Bought by
Bld Roy
Current Estimated Value
Home Financials for this Owner
Home Financials are based on the most recent Mortgage that was taken out on this home.
Original Mortgage
$240,000
Outstanding Balance
$217,763
Interest Rate
2.9%
Mortgage Type
New Conventional
Estimated Equity
$185,700
Purchase Details
Closed on
May 28, 2020
Sold by
Bingham Brent T
Bought by
Roy Bid Llc
Home Financials for this Owner
Home Financials are based on the most recent Mortgage that was taken out on this home.
Original Mortgage
$150,000
Interest Rate
3.3%
Mortgage Type
Unknown
Purchase Details
Closed on
May 26, 2020
Sold by
M Beeton Investments Llc
Bought by
Bingham Brent T
Home Financials for this Owner
Home Financials are based on the most recent Mortgage that was taken out on this home.
Original Mortgage
$150,000
Interest Rate
3.3%
Mortgage Type
Unknown
Purchase Details
Closed on
Apr 23, 2020
Sold by
Griffith Mark R
Bought by
M Beeton Investments Llc
Home Financials for this Owner
Home Financials are based on the most recent Mortgage that was taken out on this home.
Original Mortgage
$150,000
Interest Rate
3.3%
Mortgage Type
Unknown
Create a Home Valuation Report for This Property
The Home Valuation Report is an in-depth analysis detailing your home's value as well as a comparison with similar homes in the area
Home Values in the Area
Average Home Value in this Area
Purchase History
| Date | Buyer | Sale Price | Title Company |
|---|---|---|---|
| Bld Roy | -- | Charger Title | |
| Bingham Brent T | -- | Charger Title | |
| Roy Bid Llc | -- | Accommodation | |
| Bingham Brent T | -- | Steed Title Ins Agcy | |
| M Beeton Investments Llc | -- | Heritage West Title |
Source: Public Records
Mortgage History
| Date | Status | Borrower | Loan Amount |
|---|---|---|---|
| Open | Bingham Brent T | $240,000 | |
| Closed | Bld Roy | $246,000 | |
| Previous Owner | M Beeton Investments Llc | $150,000 |
Source: Public Records
Tax History
| Year | Tax Paid | Tax Assessment Tax Assessment Total Assessment is a certain percentage of the fair market value that is determined by local assessors to be the total taxable value of land and additions on the property. | Land | Improvement |
|---|---|---|---|---|
| 2025 | $2,189 | $339,420 | $116,169 | $223,251 |
| 2024 | $2,139 | $334,000 | $116,194 | $217,806 |
| 2023 | $2,155 | $339,000 | $117,989 | $221,011 |
| 2022 | $2,048 | $330,000 | $97,690 | $232,310 |
| 2021 | $1,768 | $258,000 | $63,339 | $194,661 |
| 2020 | $1,690 | $227,000 | $63,339 | $163,661 |
| 2019 | $1,582 | $199,000 | $38,660 | $160,340 |
| 2018 | $1,441 | $169,000 | $35,740 | $133,260 |
| 2017 | $1,399 | $153,910 | $34,800 | $119,110 |
| 2016 | $1,297 | $76,140 | $18,898 | $57,242 |
| 2015 | $1,152 | $68,429 | $18,898 | $49,531 |
| 2014 | $1,162 | $68,429 | $18,898 | $49,531 |
Source: Public Records
Map
Nearby Homes
Your Personal Tour Guide
Ask me questions while you tour the home.