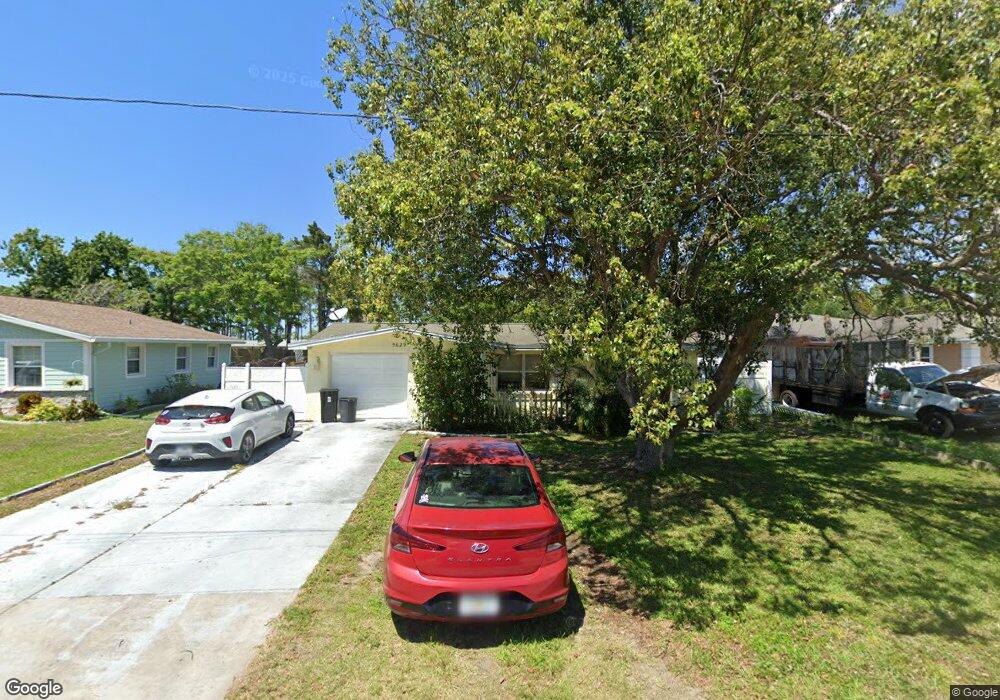
5629 Mallow St New Port Richey, FL 34652
Estimated Value: $190,000 - $224,000
2
Beds
2
Baths
996
Sq Ft
$207/Sq Ft
Est. Value
About This Home
This home is located at 5629 Mallow St, New Port Richey, FL 34652 and is currently estimated at $206,571, approximately $207 per square foot. 5629 Mallow St is a home located in Pasco County with nearby schools including Mittye P. Locke Elementary School, Richey Elementary School, and Gulf Middle School.
Ownership History
Date
Name
Owned For
Owner Type
Purchase Details
Closed on
Jun 17, 2016
Sold by
Lynn Cheryl
Bought by
Graham Glenn G
Current Estimated Value
Home Financials for this Owner
Home Financials are based on the most recent Mortgage that was taken out on this home.
Original Mortgage
$94,162
Outstanding Balance
$75,040
Interest Rate
3.61%
Mortgage Type
FHA
Estimated Equity
$131,531
Purchase Details
Closed on
Aug 28, 2006
Sold by
Lynn Cheryl
Bought by
Lynn Cheryl
Home Financials for this Owner
Home Financials are based on the most recent Mortgage that was taken out on this home.
Original Mortgage
$85,000
Interest Rate
6.67%
Mortgage Type
Stand Alone Refi Refinance Of Original Loan
Purchase Details
Closed on
Feb 2, 2000
Sold by
Cheryl Lynn Tr
Bought by
Lynn Cheryl
Purchase Details
Closed on
Dec 23, 1997
Sold by
Bevilacqua Cheryl A
Bought by
Bevilacqua Cheryl A and Reynolds Lisa M
Create a Home Valuation Report for This Property
The Home Valuation Report is an in-depth analysis detailing your home's value as well as a comparison with similar homes in the area
Home Values in the Area
Average Home Value in this Area
Purchase History
| Date | Buyer | Sale Price | Title Company |
|---|---|---|---|
| Graham Glenn G | $95,900 | Executive Title Services Of | |
| Lynn Cheryl | -- | Millenium Title Inc | |
| Lynn Cheryl | -- | -- | |
| Bevilacqua Cheryl A | $100 | -- |
Source: Public Records
Mortgage History
| Date | Status | Borrower | Loan Amount |
|---|---|---|---|
| Open | Graham Glenn G | $94,162 | |
| Previous Owner | Lynn Cheryl | $85,000 | |
| Previous Owner | Bevilacqua Cheryl A | $45,000 |
Source: Public Records
Tax History Compared to Growth
Tax History
| Year | Tax Paid | Tax Assessment Tax Assessment Total Assessment is a certain percentage of the fair market value that is determined by local assessors to be the total taxable value of land and additions on the property. | Land | Improvement |
|---|---|---|---|---|
| 2025 | $684 | $60,960 | -- | -- |
| 2024 | $684 | $59,250 | -- | -- |
| 2023 | $665 | $57,530 | $0 | $0 |
| 2022 | $613 | $55,860 | $0 | $0 |
| 2021 | $604 | $54,240 | $14,280 | $39,960 |
| 2020 | $594 | $53,500 | $12,180 | $41,320 |
| 2019 | $578 | $51,266 | $12,180 | $39,086 |
| 2018 | $571 | $51,069 | $0 | $0 |
| 2017 | $579 | $50,906 | $12,180 | $38,726 |
| 2016 | $974 | $51,069 | $12,180 | $38,889 |
| 2015 | -- | $50,972 | $12,180 | $38,792 |
| 2014 | -- | $58,019 | $15,120 | $42,899 |
Source: Public Records
Map
Nearby Homes
- 4853 Alcea St
- 5746 Embay Ave
- 4923 Alcea St
- 5753 10th Ave
- 4614 Croton Dr
- 5023 Thames Dr
- 4548 Somerset Place
- 5851 Lanate Ave
- 5419 Palm Dr Unit 130
- 5831 1st Ave
- 5434 Chad Place Unit 14
- 5434 Chad Place Unit 1
- 4746 Azalea Dr Unit 107
- 4746 Azalea Dr Unit 209
- 4746 Azalea Dr Unit 201
- 4746 Azalea Dr Unit 105
- 0 Ridgewood Dr
- 4520 Iris Dr
- 4915 Daphne St
- 5045 Grand Blvd
- 5635 Mallow St
- 5623 Mallow St
- 5617 Mallow St
- 5626 Dahlia Ave
- 5634 Dahlia Ave
- 5620 Dahlia Ave
- 5645 Mallow St
- 5640 Dahlia Ave
- 5611 Mallow St
- 5614 Dahlia Ave
- 5628 Mallow St
- 5634 Mallow St
- 5622 Mallow St
- 5646 Dahlia Ave
- 5608 Dahlia Ave
- 5701 Mallow St
- 5605 Mallow St
- 5648 Mallow St
- 5612 Mallow St
- 5652 Dahlia Ave