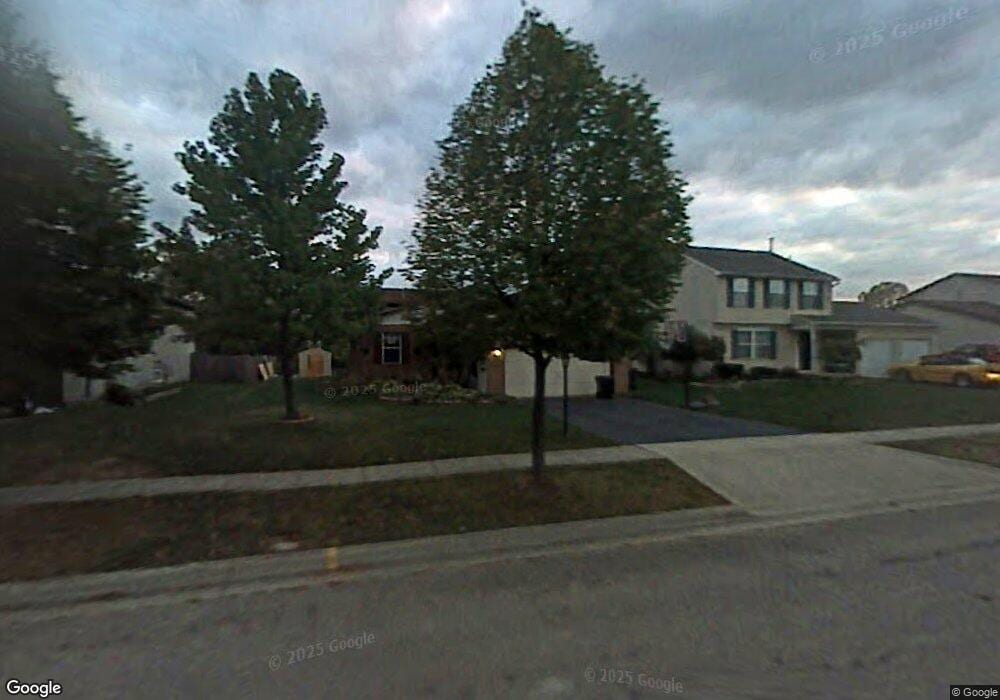
5629 Spring Hill Rd Grove City, OH 43123
Estimated Value: $316,000 - $329,000
3
Beds
2
Baths
1,408
Sq Ft
$228/Sq Ft
Est. Value
About This Home
This home is located at 5629 Spring Hill Rd, Grove City, OH 43123 and is currently estimated at $320,689, approximately $227 per square foot. 5629 Spring Hill Rd is a home located in Franklin County with nearby schools including Buckeye Woods Elementary School, Hayes Intermediate School, and Jackson Middle School.
Ownership History
Date
Name
Owned For
Owner Type
Purchase Details
Closed on
Aug 8, 2023
Sold by
Storts Charles Scott
Bought by
Storts Charles Scott and Storts Debra Ann
Current Estimated Value
Home Financials for this Owner
Home Financials are based on the most recent Mortgage that was taken out on this home.
Original Mortgage
$190,000
Outstanding Balance
$185,200
Interest Rate
6.25%
Mortgage Type
Credit Line Revolving
Estimated Equity
$135,489
Purchase Details
Closed on
Jan 31, 2003
Sold by
Slagle Jay J
Bought by
Storts Charles Scott
Home Financials for this Owner
Home Financials are based on the most recent Mortgage that was taken out on this home.
Original Mortgage
$120,988
Interest Rate
5.94%
Mortgage Type
FHA
Purchase Details
Closed on
Feb 7, 2001
Sold by
Slagle Jay J and Slagle John M
Bought by
Slagle Jay J
Purchase Details
Closed on
Dec 22, 1993
Bought by
Slagle Jay J & John M
Purchase Details
Closed on
Jul 31, 1990
Create a Home Valuation Report for This Property
The Home Valuation Report is an in-depth analysis detailing your home's value as well as a comparison with similar homes in the area
Home Values in the Area
Average Home Value in this Area
Purchase History
| Date | Buyer | Sale Price | Title Company |
|---|---|---|---|
| Storts Charles Scott | -- | Elite Land Title | |
| Storts Charles Scott | $122,900 | Chicago Title | |
| Slagle Jay J | -- | -- | |
| Slagle Jay J & John M | $95,500 | -- | |
| -- | -- | -- |
Source: Public Records
Mortgage History
| Date | Status | Borrower | Loan Amount |
|---|---|---|---|
| Open | Storts Charles Scott | $190,000 | |
| Previous Owner | Storts Charles Scott | $120,988 |
Source: Public Records
Tax History Compared to Growth
Tax History
| Year | Tax Paid | Tax Assessment Tax Assessment Total Assessment is a certain percentage of the fair market value that is determined by local assessors to be the total taxable value of land and additions on the property. | Land | Improvement |
|---|---|---|---|---|
| 2024 | $4,137 | $90,970 | $32,900 | $58,070 |
| 2023 | $4,078 | $90,970 | $32,900 | $58,070 |
| 2022 | $3,941 | $64,620 | $15,020 | $49,600 |
| 2021 | $4,017 | $64,620 | $15,020 | $49,600 |
| 2020 | $4,004 | $64,620 | $15,020 | $49,600 |
| 2019 | $3,628 | $54,320 | $12,530 | $41,790 |
| 2018 | $3,384 | $54,320 | $12,530 | $41,790 |
| 2017 | $3,601 | $54,320 | $12,530 | $41,790 |
| 2016 | $3,154 | $43,510 | $10,220 | $33,290 |
| 2015 | $3,155 | $43,510 | $10,220 | $33,290 |
| 2014 | $3,157 | $43,510 | $10,220 | $33,290 |
| 2013 | $1,419 | $41,440 | $9,730 | $31,710 |
Source: Public Records
Map
Nearby Homes
- 2433 Stargrass Ave
- 2382 Clover Blossom Ct
- 2402 Clover Blossom Ct
- 2305 Spring Cress Ave
- 2335 Fernwood Ave
- 5655 Lotus Ct
- 2384 Birch Bark Trail
- 5428 Hoover Rd
- 2383 Birch Bark Trail
- 2336 Willowside Ln Unit 2336
- 2328 Hoover Rd
- 2310 Ravine Woods Dr Unit 22
- 5796 Ravine Creek Dr
- 5232 Hoover Rd
- 5933 Landings Pond Place Unit 21
- 5941 Landings Pond Place
- 2504 Landings Way Unit 52504
- 5870 Crooked Creek Blvd Unit 5870
- 5455 Lilac Ave
- 2609 Landings Way Unit 29-D
- 5621 Spring Hill Rd
- 5637 Spring Hill Rd
- 5645 Spring Hill Rd
- 5611 Spring Hill Rd
- 5628 Spring Hill Rd
- 5618 Spring Hill Rd
- 5653 Spring Hill Rd
- 5638 Spring Hill Rd
- 5608 Spring Hill Rd
- 5648 Spring Hill Rd
- 5598 Spring Hill Rd
- 5661 Spring Hill Rd
- 5593 Spring Hill Rd
- 5658 Spring Hill Rd
- 2361 Stargrass Ave
- 2369 Stargrass Ave
- 2346 Clover Blossom Ct
- 2353 Stargrass Ave
- 5588 Spring Hill Rd
- 2377 Stargrass Ave