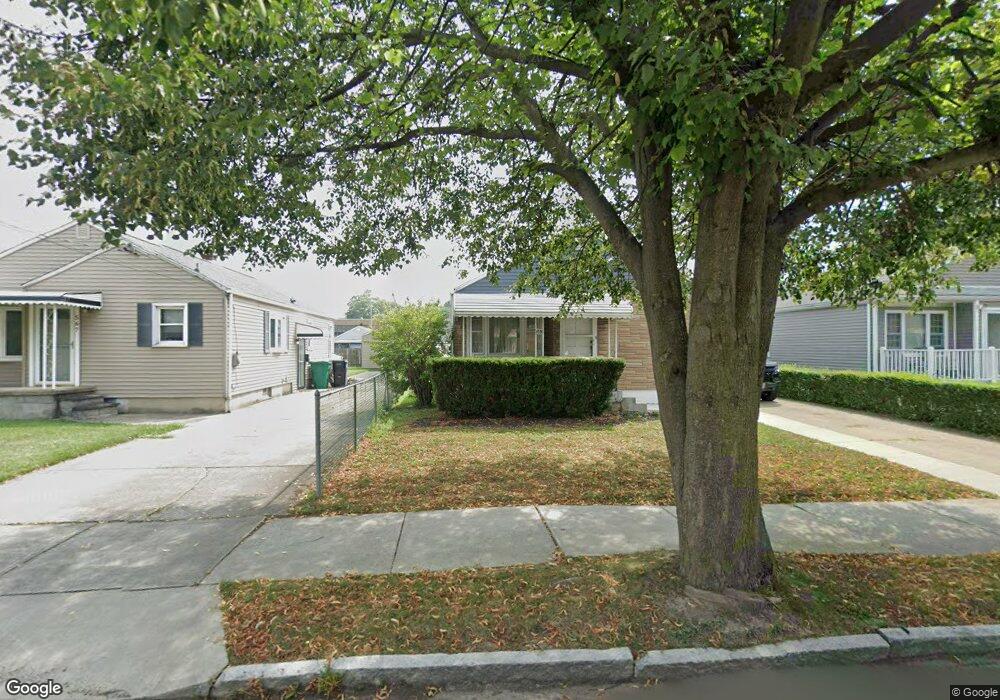
563 78th St Niagara Falls, NY 14304
LaSalle NeighborhoodEstimated Value: $149,000 - $167,526
3
Beds
1
Bath
942
Sq Ft
$169/Sq Ft
Est. Value
About This Home
This home is located at 563 78th St, Niagara Falls, NY 14304 and is currently estimated at $159,382, approximately $169 per square foot. 563 78th St is a home located in Niagara County with nearby schools including Niagara Falls High School, Catholic Academy Of Niagara Falls - Elementary, and Christ the King Preparatory Academy.
Ownership History
Date
Name
Owned For
Owner Type
Purchase Details
Closed on
May 26, 2020
Sold by
Smith Ellen and Adlhock Ellen
Bought by
Manning Matthew E
Current Estimated Value
Home Financials for this Owner
Home Financials are based on the most recent Mortgage that was taken out on this home.
Original Mortgage
$75,000
Interest Rate
3.1%
Mortgage Type
New Conventional
Purchase Details
Closed on
Jun 28, 2005
Sold by
Ann Dumych
Bought by
Adlhock Ellen
Create a Home Valuation Report for This Property
The Home Valuation Report is an in-depth analysis detailing your home's value as well as a comparison with similar homes in the area
Home Values in the Area
Average Home Value in this Area
Purchase History
| Date | Buyer | Sale Price | Title Company |
|---|---|---|---|
| Manning Matthew E | $82,000 | None Available | |
| Adlhock Ellen | -- | Billingsley Gary M |
Source: Public Records
Mortgage History
| Date | Status | Borrower | Loan Amount |
|---|---|---|---|
| Previous Owner | Manning Matthew E | $75,000 |
Source: Public Records
Tax History Compared to Growth
Tax History
| Year | Tax Paid | Tax Assessment Tax Assessment Total Assessment is a certain percentage of the fair market value that is determined by local assessors to be the total taxable value of land and additions on the property. | Land | Improvement |
|---|---|---|---|---|
| 2024 | $2,294 | $59,000 | $3,200 | $55,800 |
| 2023 | $2,294 | $59,000 | $3,200 | $55,800 |
| 2022 | $1,726 | $59,000 | $3,200 | $55,800 |
| 2021 | $1,725 | $59,000 | $3,200 | $55,800 |
| 2020 | $892 | $59,000 | $3,200 | $55,800 |
| 2019 | $554 | $59,000 | $3,200 | $55,800 |
| 2018 | $372 | $59,000 | $3,200 | $55,800 |
| 2017 | $554 | $59,000 | $3,200 | $55,800 |
| 2016 | $741 | $59,000 | $3,200 | $55,800 |
| 2015 | -- | $59,000 | $3,200 | $55,800 |
| 2014 | -- | $59,000 | $3,200 | $55,800 |
Source: Public Records
Map
Nearby Homes