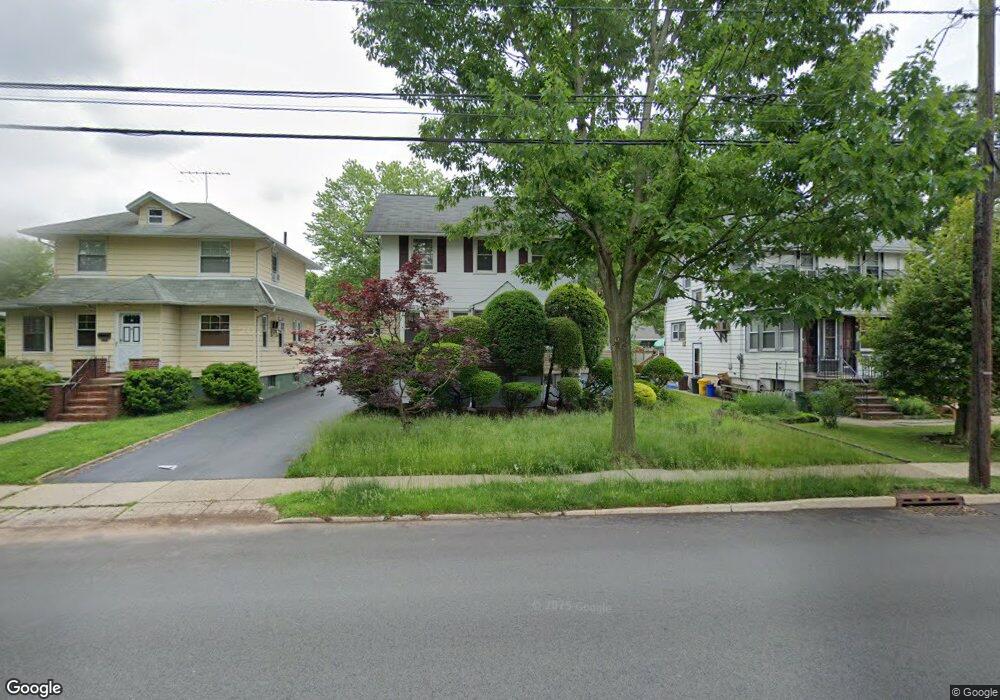
563 River Rd Teaneck, NJ 07666
Estimated Value: $605,550 - $664,000
3
Beds
2
Baths
1,406
Sq Ft
$447/Sq Ft
Est. Value
About This Home
This home is located at 563 River Rd, Teaneck, NJ 07666 and is currently estimated at $628,388, approximately $446 per square foot. 563 River Rd is a home located in Bergen County with nearby schools including Teaneck Senior High School, Teaneck Community Charter School, and Bergen County Christian Academy.
Ownership History
Date
Name
Owned For
Owner Type
Purchase Details
Closed on
Oct 21, 2021
Sold by
Cassidy Joseph W and Cassidy Anne E
Bought by
Matute Maria Veronica and Matute Bryan Francisco
Current Estimated Value
Home Financials for this Owner
Home Financials are based on the most recent Mortgage that was taken out on this home.
Original Mortgage
$398,650
Outstanding Balance
$364,526
Interest Rate
2.99%
Mortgage Type
New Conventional
Estimated Equity
$263,862
Create a Home Valuation Report for This Property
The Home Valuation Report is an in-depth analysis detailing your home's value as well as a comparison with similar homes in the area
Home Values in the Area
Average Home Value in this Area
Purchase History
| Date | Buyer | Sale Price | Title Company |
|---|---|---|---|
| Matute Maria Veronica | $469,000 | Westcor Land Title Ins Co | |
| Matute Maria Veronica | $469,000 | Caplan Emily |
Source: Public Records
Mortgage History
| Date | Status | Borrower | Loan Amount |
|---|---|---|---|
| Open | Matute Maria Veronica | $398,650 | |
| Closed | Matute Maria Veronica | $398,650 |
Source: Public Records
Tax History
| Year | Tax Paid | Tax Assessment Tax Assessment Total Assessment is a certain percentage of the fair market value that is determined by local assessors to be the total taxable value of land and additions on the property. | Land | Improvement |
|---|---|---|---|---|
| 2025 | $10,610 | $485,800 | $263,300 | $222,500 |
| 2024 | $9,483 | $485,800 | $263,300 | $222,500 |
| 2023 | $9,297 | $287,200 | $159,800 | $127,400 |
| 2022 | $9,297 | $287,200 | $159,800 | $127,400 |
| 2021 | $8,632 | $287,200 | $159,800 | $127,400 |
| 2020 | $9,288 | $287,200 | $159,800 | $127,400 |
| 2019 | $9,182 | $287,200 | $159,800 | $127,400 |
| 2018 | $9,113 | $287,200 | $159,800 | $127,400 |
| 2017 | $9,027 | $287,200 | $159,800 | $127,400 |
| 2016 | $8,892 | $287,200 | $159,800 | $127,400 |
| 2015 | $8,751 | $287,200 | $159,800 | $127,400 |
| 2014 | $7,615 | $296,200 | $220,500 | $75,700 |
Source: Public Records
Map
Nearby Homes
Your Personal Tour Guide
Ask me questions while you tour the home.