Estimated Value: $431,000 - $507,000
3
Beds
2
Baths
1,602
Sq Ft
$287/Sq Ft
Est. Value
About This Home
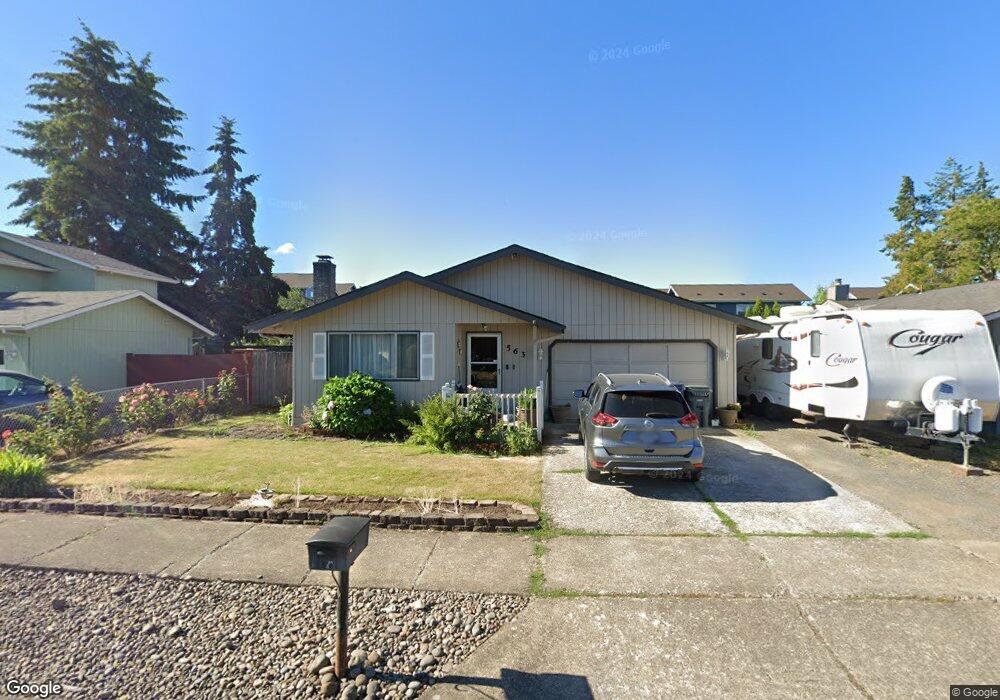
This home is located at 563 T St, Springfield, OR 97477 and is currently estimated at $459,546, approximately $286 per square foot. 563 T St is a home located in Lane County with nearby schools including Elizabeth Page Elementary School, Briggs Middle School, and Springfield High School.
Ownership History
Date
Name
Owned For
Owner Type
Purchase Details
Closed on
Jan 21, 2025
Sold by
Graham Elaine M
Bought by
Elaine Marie Graham Share Of The Graham Trust and Graham
Current Estimated Value
Purchase Details
Closed on
Jun 20, 2003
Sold by
Bestul Ernest M and Bestul Iva T
Bought by
Graham Elaine M
Home Financials for this Owner
Home Financials are based on the most recent Mortgage that was taken out on this home.
Original Mortgage
$85,000
Interest Rate
4.37%
Mortgage Type
Purchase Money Mortgage
Purchase Details
Closed on
Oct 30, 2002
Sold by
Friend Claude
Bought by
Bestul Ernest M and Bestul Iva T
Purchase Details
Closed on
Mar 8, 2002
Sold by
Friend Ruth H
Bought by
Friend Claude
Purchase Details
Closed on
Jun 13, 2001
Sold by
Friend Claude and Friend Ruth H
Bought by
Friend Claude and Friend Ruth H
Purchase Details
Closed on
Apr 12, 2001
Sold by
Joe Randazzo Jimmie and Joe T D
Bought by
Friend Claude and Ferguson Ruth H
Create a Home Valuation Report for This Property
The Home Valuation Report is an in-depth analysis detailing your home's value as well as a comparison with similar homes in the area
Home Values in the Area
Average Home Value in this Area
Purchase History
| Date | Buyer | Sale Price | Title Company |
|---|---|---|---|
| Elaine Marie Graham Share Of The Graham Trust | -- | None Listed On Document | |
| Graham Elaine M | $135,000 | Evergreen Land Title Co | |
| Bestul Ernest M | $136,000 | Evergreen Land Title Co | |
| Friend Claude | -- | -- | |
| Friend Claude | -- | -- | |
| Friend Claude | $134,500 | Western Pioneer Title Co |
Source: Public Records
Mortgage History
| Date | Status | Borrower | Loan Amount |
|---|---|---|---|
| Previous Owner | Graham Elaine M | $85,000 |
Source: Public Records
Tax History Compared to Growth
Tax History
| Year | Tax Paid | Tax Assessment Tax Assessment Total Assessment is a certain percentage of the fair market value that is determined by local assessors to be the total taxable value of land and additions on the property. | Land | Improvement |
|---|---|---|---|---|
| 2025 | $4,175 | $227,661 | -- | -- |
| 2024 | $4,107 | $221,031 | -- | -- |
| 2023 | $4,107 | $214,594 | $0 | $0 |
| 2022 | $3,804 | $208,344 | $0 | $0 |
| 2021 | $3,736 | $202,276 | $0 | $0 |
| 2020 | $3,627 | $196,385 | $0 | $0 |
| 2019 | $3,518 | $190,666 | $0 | $0 |
| 2018 | $3,316 | $179,721 | $0 | $0 |
| 2017 | $3,188 | $179,721 | $0 | $0 |
| 2016 | $3,121 | $174,486 | $0 | $0 |
| 2015 | $3,032 | $169,404 | $0 | $0 |
| 2014 | $2,977 | $164,470 | $0 | $0 |
Source: Public Records
Map
Nearby Homes