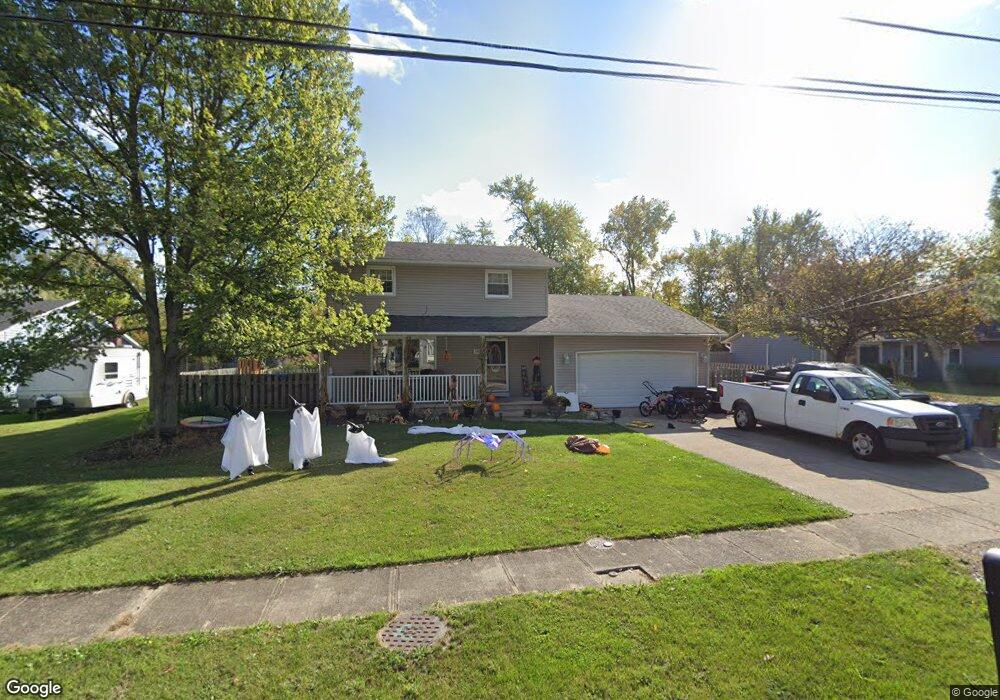
563 Treadway Blvd Sheffield Lake, OH 44054
Estimated Value: $222,000 - $282,000
3
Beds
2
Baths
1,592
Sq Ft
$165/Sq Ft
Est. Value
About This Home
This home is located at 563 Treadway Blvd, Sheffield Lake, OH 44054 and is currently estimated at $263,107, approximately $165 per square foot. 563 Treadway Blvd is a home located in Lorain County with nearby schools including Knollwood Elementary School, Brookside Intermediate School, and Brookside Middle School.
Ownership History
Date
Name
Owned For
Owner Type
Purchase Details
Closed on
Apr 27, 2017
Sold by
Dobbins Judy L
Bought by
Barker Lee A and Handy Ashley A
Current Estimated Value
Home Financials for this Owner
Home Financials are based on the most recent Mortgage that was taken out on this home.
Original Mortgage
$152,683
Outstanding Balance
$127,665
Interest Rate
4.3%
Mortgage Type
FHA
Estimated Equity
$135,442
Purchase Details
Closed on
Sep 27, 2011
Sold by
Dobbins Virgil W and Dobbins Virgil William
Bought by
Dobbins Judy L and Kelly Judy L
Purchase Details
Closed on
Nov 1, 1999
Sold by
Gerrone Thomas C
Bought by
Dobbins Virgil W and Dobbins Judy L
Home Financials for this Owner
Home Financials are based on the most recent Mortgage that was taken out on this home.
Original Mortgage
$110,000
Interest Rate
7.78%
Create a Home Valuation Report for This Property
The Home Valuation Report is an in-depth analysis detailing your home's value as well as a comparison with similar homes in the area
Home Values in the Area
Average Home Value in this Area
Purchase History
| Date | Buyer | Sale Price | Title Company |
|---|---|---|---|
| Barker Lee A | $155,500 | -- | |
| Dobbins Judy L | -- | None Available | |
| Dobbins Virgil W | $140,000 | Midland Title |
Source: Public Records
Mortgage History
| Date | Status | Borrower | Loan Amount |
|---|---|---|---|
| Open | Barker Lee A | $152,683 | |
| Previous Owner | Dobbins Virgil W | $110,000 |
Source: Public Records
Tax History Compared to Growth
Tax History
| Year | Tax Paid | Tax Assessment Tax Assessment Total Assessment is a certain percentage of the fair market value that is determined by local assessors to be the total taxable value of land and additions on the property. | Land | Improvement |
|---|---|---|---|---|
| 2024 | $3,632 | $69,752 | $8,747 | $61,005 |
| 2023 | $3,495 | $59,007 | $7,525 | $51,482 |
| 2022 | $3,462 | $59,007 | $7,525 | $51,482 |
| 2021 | $3,482 | $59,007 | $7,525 | $51,482 |
| 2020 | $3,357 | $52,040 | $6,640 | $45,400 |
| 2019 | $3,338 | $52,040 | $6,640 | $45,400 |
| 2018 | $3,351 | $52,040 | $6,640 | $45,400 |
| 2017 | $3,269 | $46,300 | $6,200 | $40,100 |
| 2016 | $3,299 | $46,300 | $6,200 | $40,100 |
| 2015 | $3,256 | $46,300 | $6,200 | $40,100 |
| 2014 | $3,207 | $50,270 | $6,730 | $43,540 |
| 2013 | $3,192 | $50,270 | $6,730 | $43,540 |
Source: Public Records
Map
Nearby Homes
- 552 Treadway Blvd
- 518 Lafayette Blvd
- 630 Treadway Blvd
- 524 Irving Park Blvd
- 689 Lafayette Blvd
- 560 Elm St
- 580 Alameda Ave
- 762 Maplewood Ave
- 738 W Shore Blvd
- 0 E Lake Rd
- 4502 Edgewater Dr
- 640 Pasadena Ave
- 644 Pasadena Ave
- 0 Woodruff Dr
- 662 Kenilworth Ave
- VL Maplewood Ave
- 0 Kenilworth Ave
- 646 Dunny Ave
- 0 Sheffield Dr
- 737 Dunny Ave
- 571 Treadway Blvd
- 555 Treadway Blvd
- 0 Treadway Blvd
- 547 Treadway Blvd
- 579 Treadway Blvd
- 570 Treadway Blvd
- 542 Treadway Blvd
- 535 Treadway Blvd
- 587 Treadway Blvd
- 4840 Pinewood Dr
- 571 Lafayette Blvd
- 4835 Pinewood Dr
- 567 Lafayette Blvd
- 4835 Richelieu Ave
- 575 Lafayette Blvd
- 532 Treadway Blvd
- 4850 Pinewood Dr
- 527 Treadway Blvd
- 4845 Pinewood Dr
- 4840 Northwood Dr