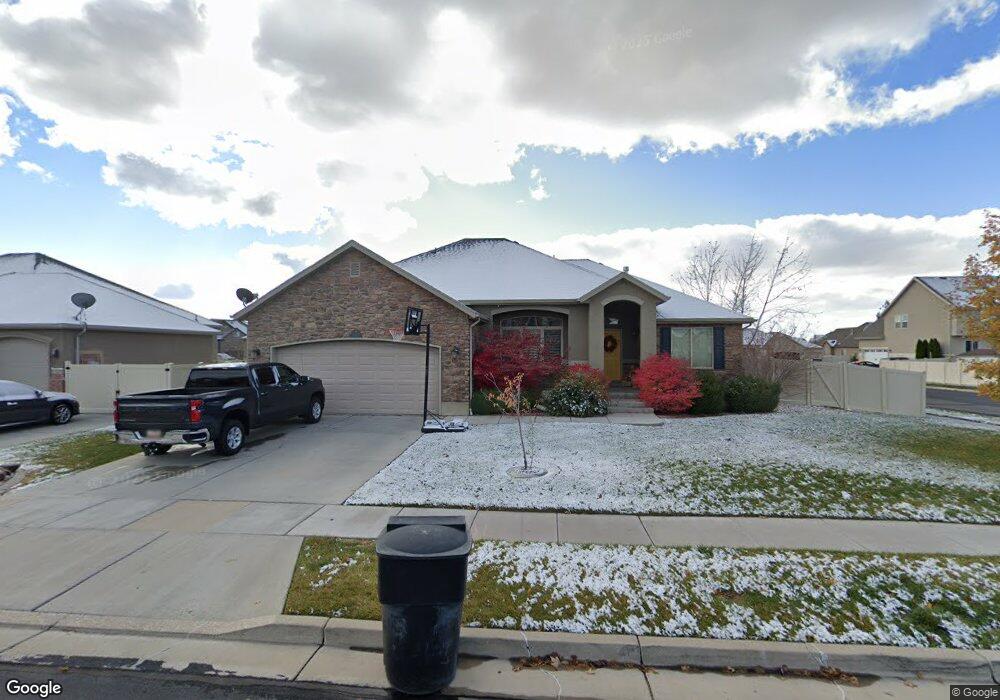
563 W 2920 S Syracuse, UT 84075
Estimated Value: $647,000 - $690,241
6
Beds
3
Baths
3,448
Sq Ft
$194/Sq Ft
Est. Value
About This Home
This home is located at 563 W 2920 S, Syracuse, UT 84075 and is currently estimated at $670,560, approximately $194 per square foot. 563 W 2920 S is a home located in Davis County with nearby schools including Bluff Ridge Elementary, Legacy Junior High School, and Clearfield High School.
Ownership History
Date
Name
Owned For
Owner Type
Purchase Details
Closed on
Nov 2, 2020
Sold by
Charles Stanley and Charles Audree Ann
Bought by
Charles Stanley
Current Estimated Value
Home Financials for this Owner
Home Financials are based on the most recent Mortgage that was taken out on this home.
Original Mortgage
$407,692
Outstanding Balance
$362,620
Interest Rate
2.9%
Mortgage Type
VA
Estimated Equity
$307,940
Purchase Details
Closed on
Oct 7, 2019
Sold by
Hawkes Noah A and Hawkes Ashley M
Bought by
Charles Stantey J and Charles Audree
Home Financials for this Owner
Home Financials are based on the most recent Mortgage that was taken out on this home.
Original Mortgage
$415,000
Interest Rate
3.5%
Mortgage Type
VA
Purchase Details
Closed on
Apr 25, 2013
Sold by
Hanson Timothy S and Hanson Celestine A
Bought by
Hawkes Noah A and Hawkes Ashley M
Home Financials for this Owner
Home Financials are based on the most recent Mortgage that was taken out on this home.
Original Mortgage
$253,326
Interest Rate
3.25%
Mortgage Type
FHA
Purchase Details
Closed on
Aug 7, 2007
Sold by
Hanson Timothy S
Bought by
Hanson Timothy S and Hanson Celestine A
Home Financials for this Owner
Home Financials are based on the most recent Mortgage that was taken out on this home.
Original Mortgage
$284,905
Interest Rate
6.65%
Mortgage Type
Purchase Money Mortgage
Purchase Details
Closed on
Nov 7, 2005
Sold by
Discovery Development Llc
Bought by
Destination Homes Inc
Home Financials for this Owner
Home Financials are based on the most recent Mortgage that was taken out on this home.
Original Mortgage
$2,227,500
Interest Rate
5.9%
Mortgage Type
Purchase Money Mortgage
Purchase Details
Closed on
Oct 28, 2005
Sold by
Chournos Lanse
Bought by
Discovery Development Llc
Home Financials for this Owner
Home Financials are based on the most recent Mortgage that was taken out on this home.
Original Mortgage
$2,227,500
Interest Rate
5.9%
Mortgage Type
Purchase Money Mortgage
Create a Home Valuation Report for This Property
The Home Valuation Report is an in-depth analysis detailing your home's value as well as a comparison with similar homes in the area
Home Values in the Area
Average Home Value in this Area
Purchase History
| Date | Buyer | Sale Price | Title Company |
|---|---|---|---|
| Charles Stanley | -- | Meridian National Title | |
| Charles Stantey J | -- | Us Title Company Of | |
| Hawkes Noah A | -- | First American Title Company | |
| Hanson Timothy S | -- | Bonneville Superior Title Co | |
| Hanson Timothy S | -- | Bonneville Superior Title Co | |
| Destination Homes Inc | -- | Bonneville Title Company | |
| Discovery Development Llc | -- | Founders Title Co |
Source: Public Records
Mortgage History
| Date | Status | Borrower | Loan Amount |
|---|---|---|---|
| Open | Charles Stanley | $407,692 | |
| Closed | Charles Stantey J | $415,000 | |
| Previous Owner | Hawkes Noah A | $253,326 | |
| Previous Owner | Hanson Timothy S | $284,905 | |
| Previous Owner | Destination Homes Inc | $2,227,500 |
Source: Public Records
Tax History
| Year | Tax Paid | Tax Assessment Tax Assessment Total Assessment is a certain percentage of the fair market value that is determined by local assessors to be the total taxable value of land and additions on the property. | Land | Improvement |
|---|---|---|---|---|
| 2025 | $2,049 | $354,200 | $117,521 | $236,679 |
| 2024 | $3,454 | $335,500 | $96,072 | $239,428 |
| 2023 | $1,788 | $578,000 | $133,929 | $444,071 |
| 2022 | $2,546 | $332,200 | $77,249 | $254,951 |
| 2021 | $2,241 | $487,000 | $114,029 | $372,971 |
| 2020 | $1,903 | $425,000 | $99,897 | $325,103 |
| 2019 | $2,410 | $346,000 | $96,954 | $249,046 |
| 2018 | $2,246 | $320,000 | $94,007 | $225,993 |
| 2016 | $2,014 | $150,536 | $36,108 | $114,428 |
| 2015 | $2,113 | $150,371 | $36,108 | $114,263 |
| 2014 | $1,962 | $142,317 | $36,108 | $106,209 |
| 2013 | -- | $142,079 | $36,655 | $105,424 |
Source: Public Records
Map
Nearby Homes