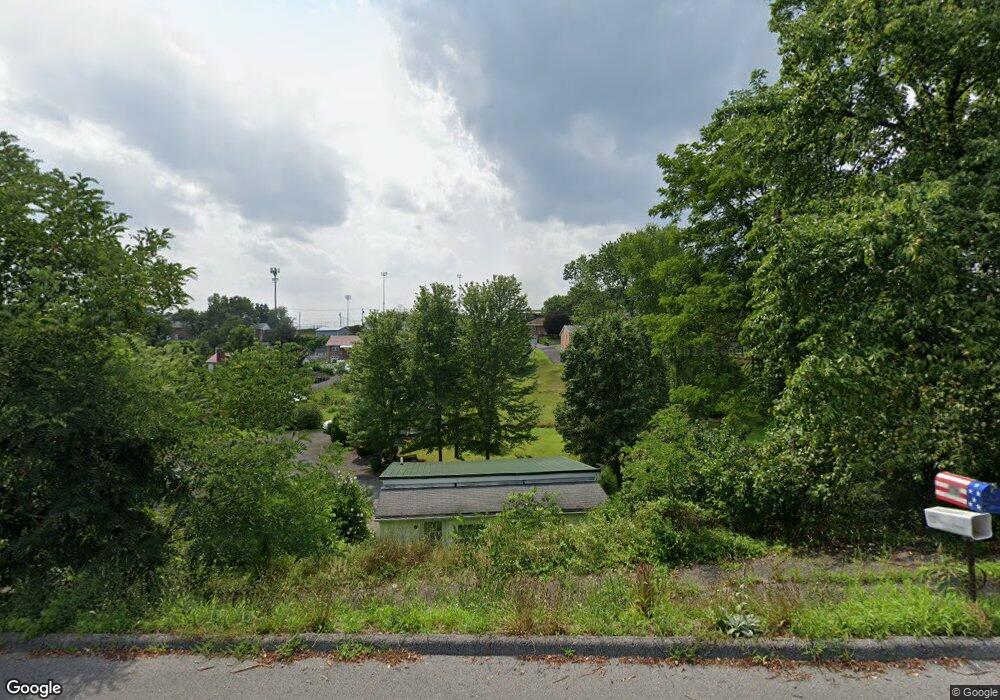
563 Winifred Rd Cumberland, MD 21502
Estimated Value: $95,000 - $151,000
--
Bed
1
Bath
864
Sq Ft
$145/Sq Ft
Est. Value
About This Home
This home is located at 563 Winifred Rd, Cumberland, MD 21502 and is currently estimated at $125,010, approximately $144 per square foot. 563 Winifred Rd is a home located in Allegany County with nearby schools including South Penn Elementary School, Washington Middle School, and Fort Hill High School.
Ownership History
Date
Name
Owned For
Owner Type
Purchase Details
Closed on
Mar 8, 2024
Sold by
Plummer Lenard
Bought by
Plummer Andy S
Current Estimated Value
Purchase Details
Closed on
May 16, 2017
Sold by
Meredith Robert O and Meredith Rita C
Bought by
Plummer Lenard
Purchase Details
Closed on
Jan 31, 2017
Sold by
Anderson Larry
Bought by
Meredith Robert O and Meredith Rita C
Purchase Details
Closed on
Jan 31, 2016
Sold by
Walsh James E
Bought by
Meredith Robert O and Meredith Rita C
Purchase Details
Closed on
May 30, 2014
Sold by
Meredith Robert O and Meredith Rita C
Bought by
Anderson Larry
Home Financials for this Owner
Home Financials are based on the most recent Mortgage that was taken out on this home.
Original Mortgage
$63,000
Interest Rate
4.27%
Mortgage Type
New Conventional
Create a Home Valuation Report for This Property
The Home Valuation Report is an in-depth analysis detailing your home's value as well as a comparison with similar homes in the area
Home Values in the Area
Average Home Value in this Area
Purchase History
| Date | Buyer | Sale Price | Title Company |
|---|---|---|---|
| Plummer Andy S | $27,000 | None Listed On Document | |
| Plummer Andy S | $27,000 | None Listed On Document | |
| Plummer Lenard | $25,000 | None Available | |
| Meredith Robert O | $30,000 | None Available | |
| Meredith Robert O | $30,000 | None Available | |
| Anderson Larry | $63,000 | None Available |
Source: Public Records
Mortgage History
| Date | Status | Borrower | Loan Amount |
|---|---|---|---|
| Previous Owner | Anderson Larry | $63,000 |
Source: Public Records
Tax History Compared to Growth
Tax History
| Year | Tax Paid | Tax Assessment Tax Assessment Total Assessment is a certain percentage of the fair market value that is determined by local assessors to be the total taxable value of land and additions on the property. | Land | Improvement |
|---|---|---|---|---|
| 2025 | $498 | $60,433 | $0 | $0 |
| 2024 | $498 | $53,167 | $0 | $0 |
| 2023 | $427 | $45,900 | $21,600 | $24,300 |
| 2022 | $477 | $45,000 | $0 | $0 |
| 2021 | $412 | $44,100 | $0 | $0 |
| 2020 | $401 | $43,200 | $18,100 | $25,100 |
| 2019 | $391 | $42,233 | $0 | $0 |
| 2018 | $389 | $41,267 | $0 | $0 |
| 2017 | $502 | $40,300 | $0 | $0 |
| 2016 | -- | $52,900 | $0 | $0 |
| 2015 | $464 | $50,500 | $0 | $0 |
| 2014 | $464 | $48,100 | $0 | $0 |
Source: Public Records
Map
Nearby Homes
- 604 Winifred Rd
- 531 Winifred Rd
- 528 Avondale Ave
- 1006 Kent Ave
- 810 Winifred Rd
- 805 White Ave
- 840 Williams St
- 458 Williams St
- 2 1 Utah Ave
- 604 Kent Ave
- 723 Glenmore St
- 331 Francis Ct
- 400 Louisiana Ave
- 360 Williams St
- 402 Louisiana Ave
- 411 Louisiana Ave
- 717 Louisiana Ave
- 32 Blackiston Ave
- 22 S Massachusetts Ave
- 652 Baker St