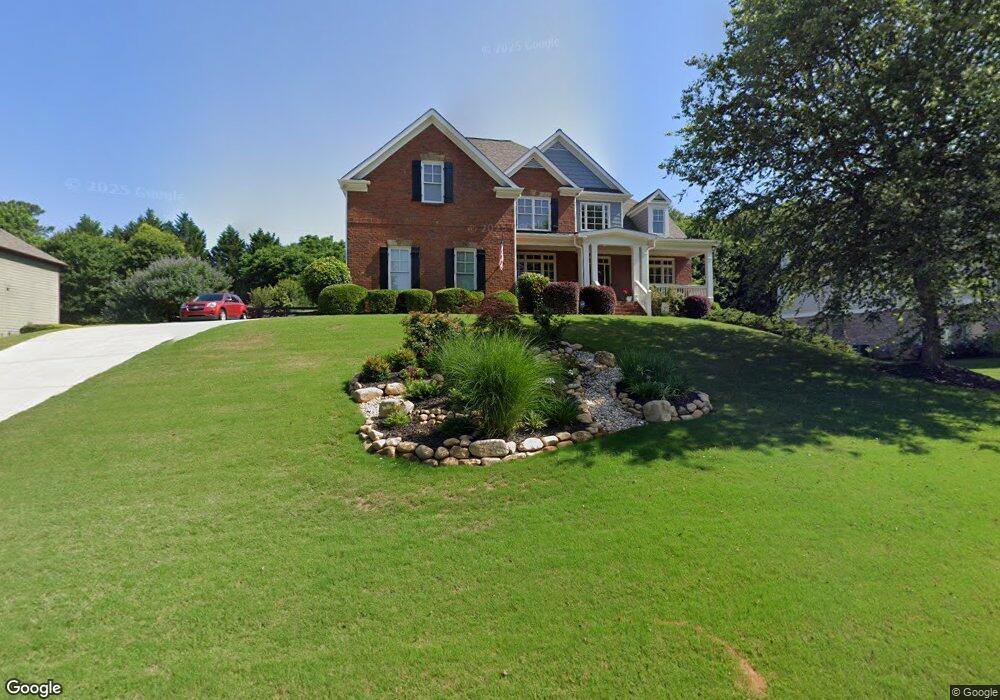
5630 Cascade Tr Cumming, GA 30040
Estimated Value: $672,000 - $799,000
4
Beds
3
Baths
3,023
Sq Ft
$248/Sq Ft
Est. Value
About This Home
This home is located at 5630 Cascade Tr, Cumming, GA 30040 and is currently estimated at $749,185, approximately $247 per square foot. 5630 Cascade Tr is a home located in Forsyth County with nearby schools including Matt Elementary School, Liberty Middle School, and North Forsyth High School.
Ownership History
Date
Name
Owned For
Owner Type
Purchase Details
Closed on
Nov 15, 2019
Sold by
Bruckner William F
Bought by
Wilbanks William M and Wilbanks Patricia Ann
Current Estimated Value
Home Financials for this Owner
Home Financials are based on the most recent Mortgage that was taken out on this home.
Original Mortgage
$407,700
Outstanding Balance
$356,138
Interest Rate
3.6%
Mortgage Type
New Conventional
Estimated Equity
$393,047
Purchase Details
Closed on
Jan 31, 2019
Sold by
Treto Jesus
Bought by
Bruckner William F and Bruckner Lynn M
Home Financials for this Owner
Home Financials are based on the most recent Mortgage that was taken out on this home.
Original Mortgage
$353,600
Interest Rate
4%
Mortgage Type
New Conventional
Purchase Details
Closed on
Sep 19, 2008
Sold by
Milestone Homes Llc
Bought by
Treto Jesus and Vissepo Miriam
Create a Home Valuation Report for This Property
The Home Valuation Report is an in-depth analysis detailing your home's value as well as a comparison with similar homes in the area
Home Values in the Area
Average Home Value in this Area
Purchase History
We collect this data history from publicly available records. To have your information removed, we recommend requesting removal directly through your county’s website.
| Date | Buyer | Sale Price | Title Company |
|---|---|---|---|
| Wilbanks William M | $453,000 | -- | |
| Bruckner William F | $442,000 | -- | |
| Treto Jesus | $342,500 | -- |
Source: Public Records
Mortgage History
We collect this data history from publicly available records. To have your information removed, we recommend requesting removal directly through your county’s website.
| Date | Status | Borrower | Loan Amount |
|---|---|---|---|
| Open | Wilbanks William M | $407,700 | |
| Previous Owner | Bruckner William F | $353,600 |
Source: Public Records
Tax History
| Year | Tax Paid | Tax Assessment Tax Assessment Total Assessment is a certain percentage of the fair market value that is determined by local assessors to be the total taxable value of land and additions on the property. | Land | Improvement |
|---|---|---|---|---|
| 2025 | $5,982 | $283,704 | $40,000 | $243,704 |
| 2024 | $5,898 | $281,668 | $40,000 | $241,668 |
| 2023 | $5,181 | $259,800 | $30,000 | $229,800 |
| 2022 | $5,365 | $173,760 | $24,000 | $149,760 |
| 2021 | $4,581 | $173,760 | $24,000 | $149,760 |
| 2020 | $4,451 | $167,452 | $24,000 | $143,452 |
| 2019 | $4,061 | $155,512 | $22,000 | $133,512 |
| 2018 | $3,668 | $136,364 | $22,000 | $114,364 |
| 2017 | $3,628 | $133,868 | $22,000 | $111,868 |
| 2016 | $3,628 | $133,868 | $22,000 | $111,868 |
| 2015 | $3,634 | $133,868 | $22,000 | $111,868 |
| 2014 | $3,199 | $124,128 | $0 | $0 |
Source: Public Records
Map
Nearby Homes
- 5660 Cascade Trail
- 0 Hendrix Rd Unit 10699227
- 0 Hendrix Rd Unit 7725583
- 5640 Lake Oak Landing
- 5825 Aspen Forest Ct
- 5740 Cascade Trail
- 5835 Catalpa Ct
- 5945 Broadwater Trail
- 5920 Broadwater Trail
- 5940 Boulder Bluff Dr
- 5315 Hendrix Rd
- 6045 Overlook Park Dr
- 5590 John Burruss Rd
- 7455 Ivy Grove St
- 6315 Tamarack Trail
- 5580 Mills Ln
- 5555 John Burruss Rd
- 6105 Clydesdale Ct
- 6110 Clydesdale Ct
- 7450 Trotting Trail
- 5630 Cascade Trail 0
- 5630 Cascade Trail
- 5620 Cascade Trail
- 5640 Cascade Trail
- 5635 Cascade Trail
- 5615 Cascade Trail
- 5650 Cascade Trail
- 5610 Cascade Trail
- 5625 Cascade Trail
- 5655 Cascade Trail
- 5605 Cascade Trail
- 0 Hendrix Rd
- 0 Hendrix Rd Unit 20049941
- 0 Hendrix Rd Unit 6764030
- 0 Hendrix Rd Unit 9021768
- 5370 Lake Oak Landing
- 5515 Hendrix Rd
- 5555 Hendrix Rd
- 5620 Lake Oak Landing Unit Lot 94
- 5620 Lake Oak Landing
Your Personal Tour Guide
Ask me questions while you tour the home.