Estimated Value: $355,000 - $435,000
3
Beds
1
Bath
1,229
Sq Ft
$311/Sq Ft
Est. Value
About This Home
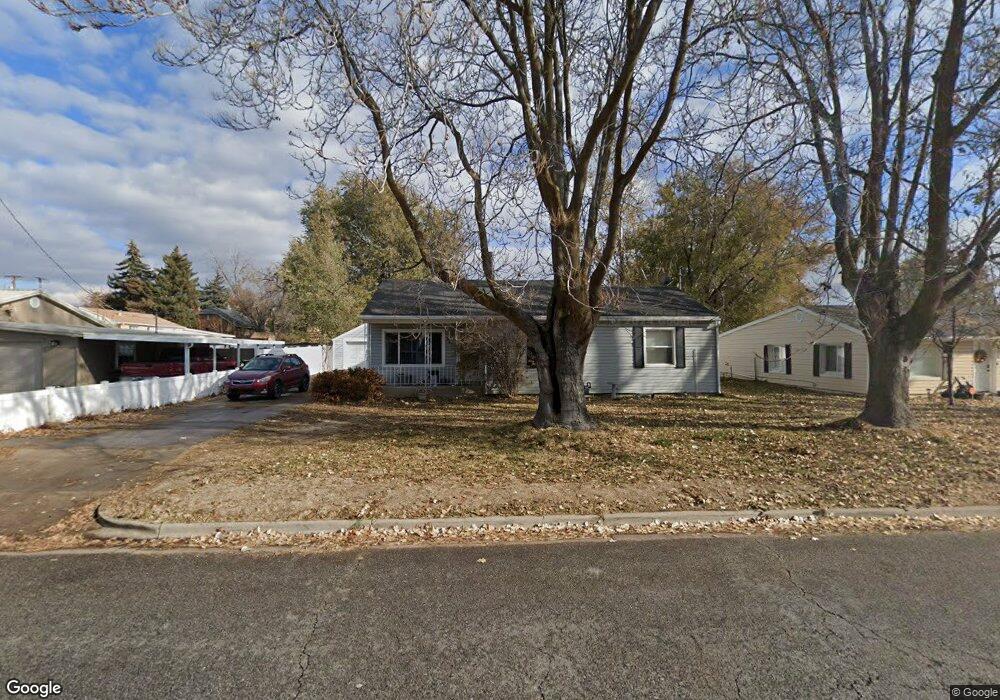
This home is located at 5630 S 2800 W, Roy, UT 84067 and is currently estimated at $382,102, approximately $310 per square foot. 5630 S 2800 W is a home located in Weber County with nearby schools including Roy Elementary School, Roy Junior High School, and Roy High School.
Ownership History
Date
Name
Owned For
Owner Type
Purchase Details
Closed on
Dec 28, 2020
Sold by
Beard Deanna
Bought by
Olsen Ashton S and Walker Ariel N
Current Estimated Value
Home Financials for this Owner
Home Financials are based on the most recent Mortgage that was taken out on this home.
Original Mortgage
$263,150
Outstanding Balance
$235,232
Interest Rate
2.8%
Mortgage Type
New Conventional
Estimated Equity
$146,870
Purchase Details
Closed on
Jul 7, 2017
Sold by
Young Brandon D and Forsberg Tarah L
Bought by
Beard Deanna
Purchase Details
Closed on
Dec 22, 2010
Sold by
Hendry Marilyn B
Bought by
Hendry Marilyn B
Home Financials for this Owner
Home Financials are based on the most recent Mortgage that was taken out on this home.
Original Mortgage
$99,200
Interest Rate
4.17%
Mortgage Type
New Conventional
Purchase Details
Closed on
Sep 8, 1997
Sold by
Bateman Brett R and Bateman Monica
Bought by
Hendry Marilyn B
Home Financials for this Owner
Home Financials are based on the most recent Mortgage that was taken out on this home.
Original Mortgage
$90,491
Interest Rate
7.42%
Mortgage Type
FHA
Create a Home Valuation Report for This Property
The Home Valuation Report is an in-depth analysis detailing your home's value as well as a comparison with similar homes in the area
Home Values in the Area
Average Home Value in this Area
Purchase History
| Date | Buyer | Sale Price | Title Company |
|---|---|---|---|
| Olsen Ashton S | -- | Cottonwood Title Ins Agency | |
| Beard Deanna | -- | Metro National Title | |
| Hendry Marilyn B | -- | Bonneville Superior Title Co | |
| Hendry Marilyn B | -- | Backman Stewart Title |
Source: Public Records
Mortgage History
| Date | Status | Borrower | Loan Amount |
|---|---|---|---|
| Open | Olsen Ashton S | $263,150 | |
| Previous Owner | Hendry Marilyn B | $99,200 | |
| Previous Owner | Hendry Marilyn B | $90,491 |
Source: Public Records
Tax History Compared to Growth
Tax History
| Year | Tax Paid | Tax Assessment Tax Assessment Total Assessment is a certain percentage of the fair market value that is determined by local assessors to be the total taxable value of land and additions on the property. | Land | Improvement |
|---|---|---|---|---|
| 2025 | $2,141 | $329,774 | $132,794 | $196,980 |
| 2024 | $2,095 | $178,748 | $73,052 | $105,696 |
| 2023 | $2,004 | $171,050 | $68,988 | $102,062 |
| 2022 | $2,072 | $183,150 | $59,197 | $123,953 |
| 2021 | $1,787 | $260,000 | $70,571 | $189,429 |
| 2020 | $1,729 | $232,000 | $70,571 | $161,429 |
| 2019 | $1,622 | $204,000 | $44,499 | $159,501 |
| 2018 | $1,549 | $183,000 | $41,457 | $141,543 |
| 2017 | $1,362 | $148,785 | $39,922 | $108,863 |
| 2016 | $1,271 | $74,156 | $20,237 | $53,919 |
| 2015 | $1,183 | $70,414 | $20,237 | $50,177 |
| 2014 | $1,192 | $70,414 | $20,237 | $50,177 |
Source: Public Records
Map
Nearby Homes
- 2786 W 5550 S Unit C11
- 2778 W 5550 S Unit 28
- 2646 W 5625 S Unit M-2646
- 2907 W 5775 S
- 2672 W 5750 S
- 2571 W 5725 S
- 2829 W 5925 S
- 2587 W 5750 S
- 5317 S 2690 W
- 3166 W 5625 S
- 5538 S 3150 W
- 3176 W 5625 S
- 3186 W 5625 S
- 5810 S 2550 W
- 5432 S 3150 W
- 5326 S 2675 W
- 3198 W 5825 S
- 3009 W 6000 S
- 5321 S 3100 W
- 5998 S 3100 W