Estimated Value: $658,000 - $741,000
5
Beds
4
Baths
4,698
Sq Ft
$152/Sq Ft
Est. Value
About This Home
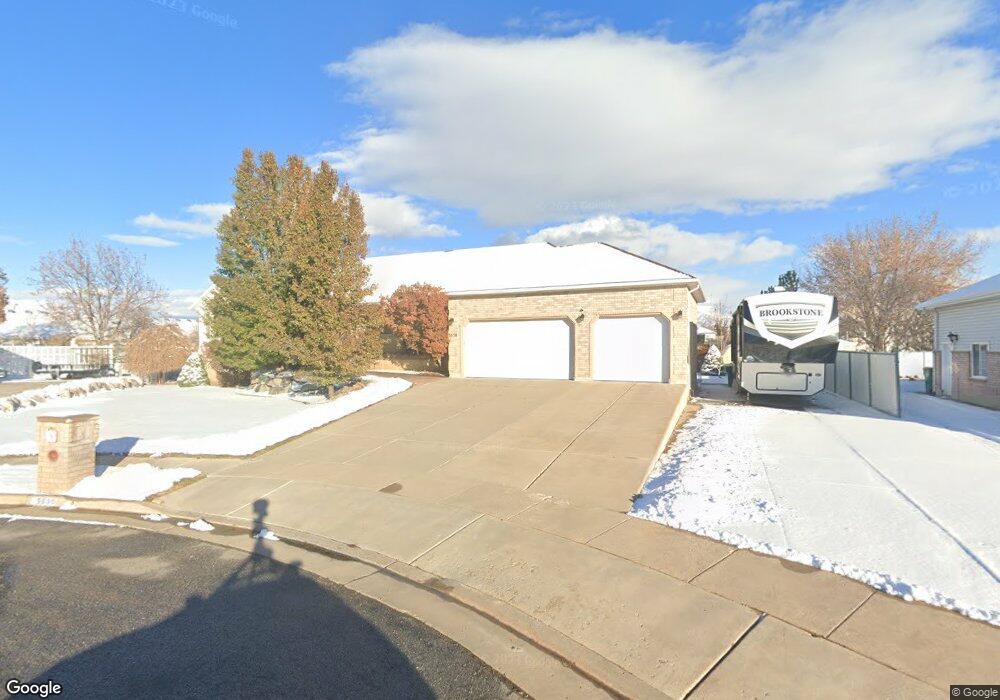
This home is located at 5630 S 3700 W, Roy, UT 84067 and is currently estimated at $714,345, approximately $152 per square foot. 5630 S 3700 W is a home located in Weber County with nearby schools including Midland School, Roy Junior High School, and Roy High School.
Ownership History
Date
Name
Owned For
Owner Type
Purchase Details
Closed on
Aug 22, 2019
Sold by
Bowman Mark J and Bowman Ruth C
Bought by
Bowman Mark Jay and Bowman Ruth Carmen
Current Estimated Value
Purchase Details
Closed on
Sep 30, 2009
Sold by
Wayment Arlene
Bought by
Bowman Mark J and Bowman Ruth C
Home Financials for this Owner
Home Financials are based on the most recent Mortgage that was taken out on this home.
Original Mortgage
$348,471
Outstanding Balance
$227,546
Interest Rate
5.08%
Mortgage Type
FHA
Estimated Equity
$486,799
Purchase Details
Closed on
Jun 25, 2007
Sold by
Nielsen E Don and Nielsen Renee Leona
Bought by
Wayment Arlene
Purchase Details
Closed on
May 3, 2000
Sold by
Nielsen E Don and Nielsen Renee
Bought by
Nielsen E Don and Nielsen Renee
Create a Home Valuation Report for This Property
The Home Valuation Report is an in-depth analysis detailing your home's value as well as a comparison with similar homes in the area
Home Values in the Area
Average Home Value in this Area
Purchase History
| Date | Buyer | Sale Price | Title Company |
|---|---|---|---|
| Bowman Mark Jay | -- | None Available | |
| Bowman Mark J | -- | Backman Ntp | |
| Wayment Arlene | -- | Intermountain Title | |
| Nielsen E Don | -- | -- |
Source: Public Records
Mortgage History
| Date | Status | Borrower | Loan Amount |
|---|---|---|---|
| Open | Bowman Mark J | $348,471 |
Source: Public Records
Tax History Compared to Growth
Tax History
| Year | Tax Paid | Tax Assessment Tax Assessment Total Assessment is a certain percentage of the fair market value that is determined by local assessors to be the total taxable value of land and additions on the property. | Land | Improvement |
|---|---|---|---|---|
| 2025 | $4,389 | $720,102 | $182,911 | $537,191 |
| 2024 | $4,280 | $388,849 | $100,601 | $288,248 |
| 2023 | $4,325 | $394,900 | $99,460 | $295,440 |
| 2022 | $4,191 | $390,500 | $79,615 | $310,885 |
| 2021 | $3,625 | $558,000 | $88,362 | $469,638 |
| 2020 | $3,327 | $469,000 | $88,362 | $380,638 |
| 2019 | $3,281 | $437,000 | $67,422 | $369,578 |
| 2018 | $3,089 | $388,000 | $67,422 | $320,578 |
| 2017 | $3,072 | $364,000 | $57,121 | $306,879 |
| 2016 | $3,037 | $194,267 | $30,916 | $163,351 |
| 2015 | $2,947 | $194,267 | $36,438 | $157,829 |
| 2014 | $2,996 | $195,785 | $36,438 | $159,347 |
Source: Public Records
Map
Nearby Homes