5631 W Josh St Springfield, MO 65802
Estimated Value: $235,000 - $244,838
3
Beds
2
Baths
1,424
Sq Ft
$168/Sq Ft
Est. Value
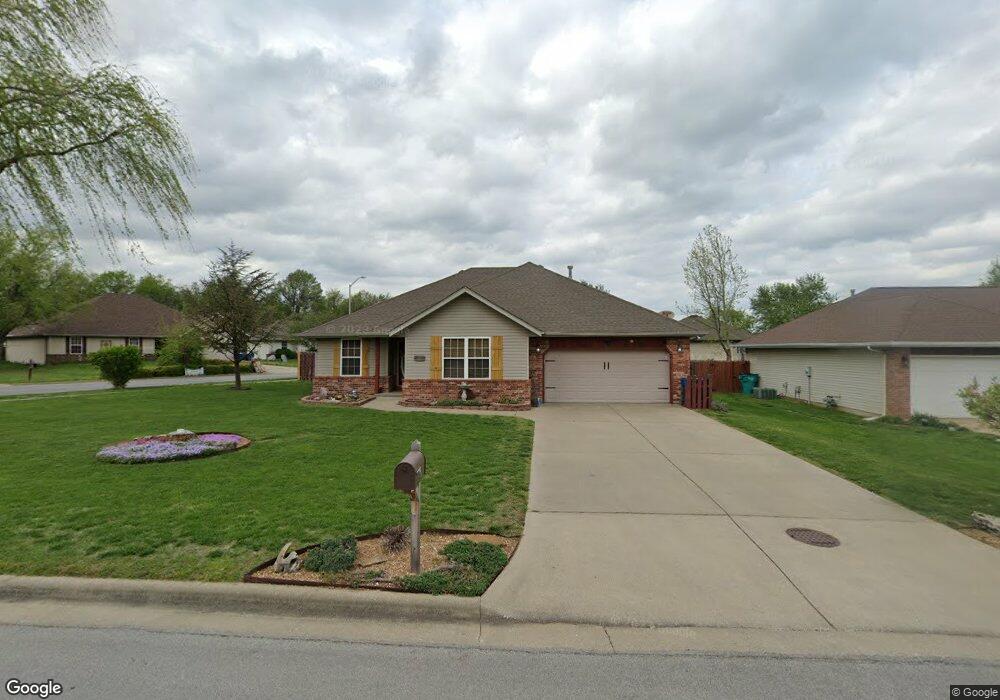
About This Home
This home is located at 5631 W Josh St, Springfield, MO 65802 and is currently estimated at $239,210, approximately $167 per square foot. 5631 W Josh St is a home located in Greene County with nearby schools including Willard Orchard Hills Elementary School, Willard Intermediate-South, and Willard High School.
Ownership History
Date
Name
Owned For
Owner Type
Purchase Details
Closed on
Apr 5, 2006
Sold by
Roberts Homes Inc
Bought by
Rogers Craig L and Rogers Kelli A
Current Estimated Value
Home Financials for this Owner
Home Financials are based on the most recent Mortgage that was taken out on this home.
Original Mortgage
$24,380
Interest Rate
5.96%
Mortgage Type
Stand Alone Second
Purchase Details
Closed on
May 13, 2005
Sold by
Deer Run Development Llp
Bought by
Roberts Home Inc
Create a Home Valuation Report for This Property
The Home Valuation Report is an in-depth analysis detailing your home's value as well as a comparison with similar homes in the area
Home Values in the Area
Average Home Value in this Area
Purchase History
| Date | Buyer | Sale Price | Title Company |
|---|---|---|---|
| Rogers Craig L | -- | None Available | |
| Roberts Home Inc | -- | None Available |
Source: Public Records
Mortgage History
| Date | Status | Borrower | Loan Amount |
|---|---|---|---|
| Closed | Rogers Craig L | $24,380 | |
| Open | Rogers Craig L | $97,520 |
Source: Public Records
Tax History Compared to Growth
Tax History
| Year | Tax Paid | Tax Assessment Tax Assessment Total Assessment is a certain percentage of the fair market value that is determined by local assessors to be the total taxable value of land and additions on the property. | Land | Improvement |
|---|---|---|---|---|
| 2025 | $1,469 | $34,330 | $8,550 | $25,780 |
| 2024 | $1,469 | $26,200 | $3,800 | $22,400 |
| 2023 | $1,462 | $26,200 | $3,800 | $22,400 |
| 2022 | $1,303 | $23,140 | $3,800 | $19,340 |
| 2021 | $1,304 | $23,140 | $3,800 | $19,340 |
| 2020 | $1,093 | $21,070 | $3,800 | $17,270 |
| 2019 | $1,089 | $21,070 | $3,800 | $17,270 |
| 2018 | $1,059 | $20,370 | $3,800 | $16,570 |
| 2017 | $1,050 | $20,370 | $3,800 | $16,570 |
| 2016 | $1,044 | $20,370 | $3,800 | $16,570 |
| 2015 | $1,037 | $20,370 | $3,800 | $16,570 |
| 2014 | $1,035 | $20,200 | $3,800 | $16,400 |
Source: Public Records
Map
Nearby Homes
- 995 S Natalie Ave
- 923 S Natalie Ave
- 5640 W Sunflower Dr
- 5590 W Sunflower Dr
- 5610 W Sugar Pine Dr
- 1069 S Red Cedar Ave
- 768 S Long Dr
- 5441 Basswood Ct W
- 5721 W Alexa Ln
- 5353 Butternut Dr
- 1128 S Brecklyn Rd
- 834 S Lester Rd
- 5163 W Sunstruck St
- 5175 W Sunstruck St
- 5131 W Sunstruck St
- 5134 W Sunstruck St
- 000 W Independence Dr
- 5033 W Skyler Dr
- 5147 W Sunstruck St
- 1161 S Broadview Ave
- 5623 W Josh St
- 5615 W Josh St
- 955 S Natalie Ave
- 944 S Natalie Ave
- 963 S Natalie Ave
- 947 S Natalie Ave
- 5630 W Josh St
- 939 S Natalie Ave
- 5607 W Josh St
- 5612 W Lombard St
- 974 S Dusty Ave
- 987 S Natalie Ave
- 931 S Natalie Ave
- 5606 W Josh St
- 5604 W Lombard St
- 5599 W Josh St
- 979 S Natalie Ave
- 5598 W Josh St
- 5596 W Lombard St
- 5609 W Lombard St