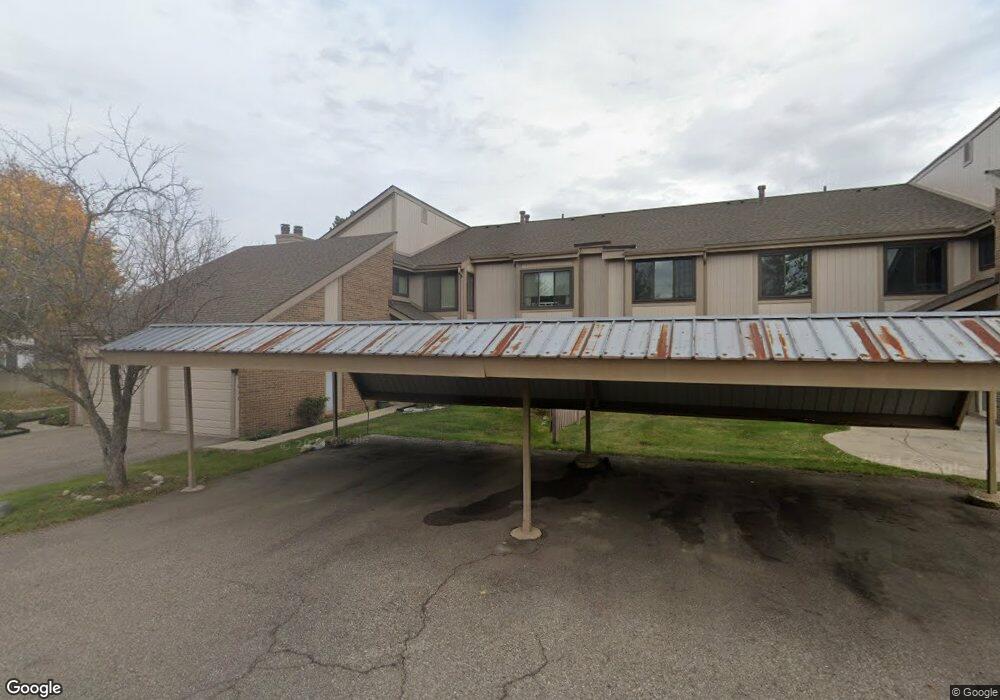
5632 Carol Ct Unit CRT West Bloomfield, MI 48322
Estimated Value: $228,000 - $248,000
3
Beds
2
Baths
1,604
Sq Ft
$149/Sq Ft
Est. Value
About This Home
This home is located at 5632 Carol Ct Unit CRT, West Bloomfield, MI 48322 and is currently estimated at $239,153, approximately $149 per square foot. 5632 Carol Ct Unit CRT is a home located in Oakland County with nearby schools including Sheiko Elementary School, West Bloomfield Middle School, and Bloomfield Maples Montessori.
Ownership History
Date
Name
Owned For
Owner Type
Purchase Details
Closed on
May 24, 2021
Sold by
Patterson Monique
Bought by
Patterson Ross Joseph and Patterson Monique
Current Estimated Value
Purchase Details
Closed on
Mar 15, 2021
Sold by
Nash Shelteny and Valentine Roderick N
Bought by
Patterson Monique A
Purchase Details
Closed on
Sep 30, 2016
Sold by
Nash Shelteny
Bought by
Nash Shelteny and Valentine Roderick N
Purchase Details
Closed on
Oct 10, 2000
Sold by
Bloch Maurice
Bought by
Maurice Bloch Tr
Create a Home Valuation Report for This Property
The Home Valuation Report is an in-depth analysis detailing your home's value as well as a comparison with similar homes in the area
Home Values in the Area
Average Home Value in this Area
Purchase History
| Date | Buyer | Sale Price | Title Company |
|---|---|---|---|
| Patterson Ross Joseph | -- | None Available | |
| Patterson Monique A | $145,000 | Title One Inc | |
| Nash Shelteny | -- | None Available | |
| Nash Shelteny | $119,000 | None Available | |
| Maurice Bloch Tr | -- | -- |
Source: Public Records
Tax History Compared to Growth
Tax History
| Year | Tax Paid | Tax Assessment Tax Assessment Total Assessment is a certain percentage of the fair market value that is determined by local assessors to be the total taxable value of land and additions on the property. | Land | Improvement |
|---|---|---|---|---|
| 2024 | $2,230 | $103,540 | $0 | $0 |
| 2022 | $2,135 | $86,270 | $17,000 | $69,270 |
| 2021 | $2,871 | $83,660 | $0 | $0 |
| 2020 | $2,883 | $79,510 | $16,880 | $62,630 |
| 2018 | $2,768 | $69,970 | $16,880 | $53,090 |
| 2015 | -- | $55,270 | $0 | $0 |
| 2014 | -- | $48,650 | $0 | $0 |
| 2011 | -- | $50,740 | $0 | $0 |
Source: Public Records
Map
Nearby Homes
- 6265 Potomac Cir
- 5353 Wright Way W
- 5106 Rock Run
- 5216 Brett Ct Unit 53
- 5727 Royal Wood
- 6323 Potomac Cir Unit 22
- 5015 Langlewood Dr
- 6684 Stonebridge E
- 5023 Meadowbrook Dr
- 5720 Beauchamp
- 6121 Westbrooke Dr Unit 7
- 6607 Westbrooke Ct
- 5428 Hammersmith Dr
- 5965 Crestwood Dr
- 6783 Burtonwood Dr
- 5016 Patrick Rd
- 5835 Drake Rd
- 6067 Charles Dr
- 6880 Burtonwood Dr
- 5426 N Piccadilly
- 5632 Carol Ct
- 5632 Carol Ct
- 5407 Carol Run W
- 5405 Carol Run W
- 5622 Carol Run N
- 5620 Carol Run N Unit 15
- 5618 Carol Run N
- 5400 Carol Run W
- 5406 Carol Run W Unit 25
- 5402 Carol Run W
- 5404 Carol Run W Unit 21
- 5439 Carol Run W Unit 12
- 5437 Carol Run W
- 5435 Carol Run W
- 5421 Carol Run W
- 5417 Carol Run W Unit 6
- 5402 Carol Run W Unit 24
- 5634 Carol Run Ct Ct
- 5421 Carol Run W Unit 8
- 5435 Carol Run W Unit 10