F
Landlord's Agent in 2014
Frank Xiao Y Lin
Prominent Realty Group LLC
Estimated Value: $409,447 - $440,000
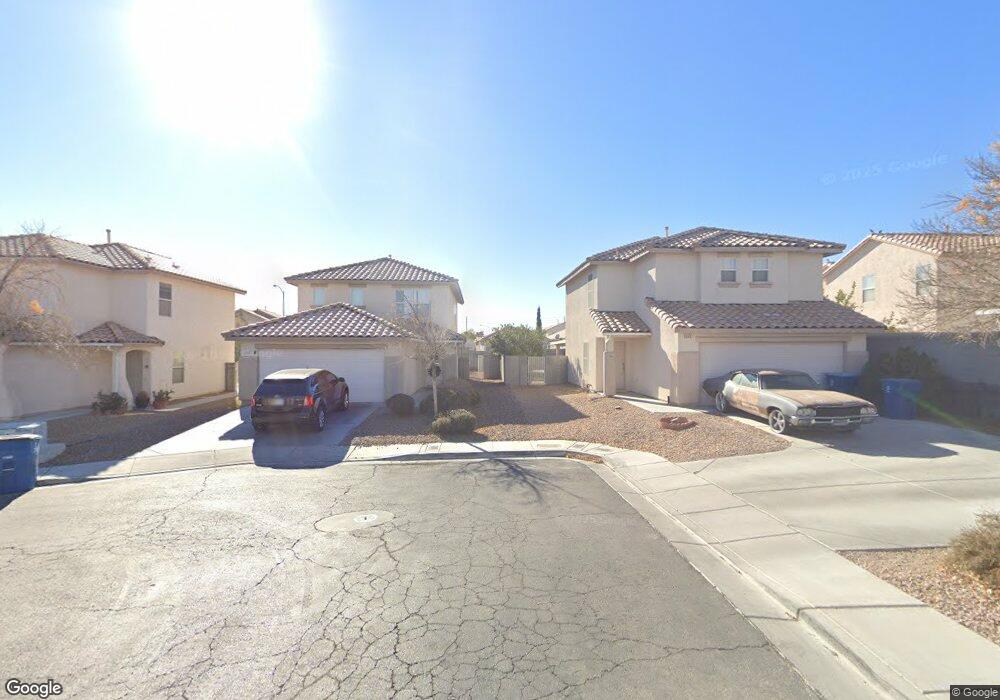
Stunning 2 story home in the southwest! Easy access to freeways and shopping ! Quiet Culdesac . Oversized lot! New 2 tone interior paint! New upgraded flooring! Blinds! open floor plan, Master suite with walk in closet! Lockbox code FUN.
Last Agent to Rent the Property
Frank Xiao Y Lin
Prominent Realty Group LLC License #S.0172928 Listed on: 02/27/2014
Last Renter's Agent
Frank Xiao Y Lin
Prominent Realty Group LLC License #S.0172928 Listed on: 02/27/2014
| Date | Buyer | Sale Price | Title Company |
|---|---|---|---|
| Wong Burton J | -- | None Available | |
| Gee Victor | $183,000 | Fidelity National Title | |
| Chaves Paul P | $167,666 | First American Title Co |
| Date | Status | Borrower | Loan Amount |
|---|---|---|---|
| Previous Owner | Chaves Paul P | $134,100 |
| Date | Event | Price | List to Sale | Price per Sq Ft |
|---|---|---|---|---|
| 02/27/2014 02/27/14 | For Rent | $1,250 | +13.6% | -- |
| 02/27/2014 02/27/14 | Rented | $1,100 | -- | -- |
| Year | Tax Paid | Tax Assessment Tax Assessment Total Assessment is a certain percentage of the fair market value that is determined by local assessors to be the total taxable value of land and additions on the property. | Land | Improvement |
|---|---|---|---|---|
| 2025 | $2,275 | $98,971 | $30,800 | $68,171 |
| 2024 | $2,107 | $98,971 | $30,800 | $68,171 |
| 2023 | $2,107 | $95,113 | $30,800 | $64,313 |
| 2022 | $1,951 | $83,964 | $25,200 | $58,764 |
| 2021 | $1,807 | $80,040 | $24,150 | $55,890 |
| 2020 | $1,675 | $77,131 | $21,700 | $55,431 |
| 2019 | $1,570 | $73,814 | $19,250 | $54,564 |
| 2018 | $1,498 | $67,606 | $15,400 | $52,206 |
| 2017 | $1,971 | $67,204 | $14,350 | $52,854 |
| 2016 | $1,403 | $64,293 | $11,550 | $52,743 |
| 2015 | $1,399 | $53,793 | $7,000 | $46,793 |
| 2014 | $1,356 | $44,847 | $7,000 | $37,847 |
F
Landlord's Agent in 2014
Frank Xiao Y Lin
Prominent Realty Group LLC
Source: Las Vegas REALTORS®
MLS Number: 1424832
APN: 163-25-413-022
Disclaimer: Certain information contained herein is derived from information provided by parties other than Homes.com. All information provided is deemed reliable, but is not guaranteed to be accurate and should be independently verified.
![]() The data relating to real estate for sale on this web site comes in part from the INTERNET DATA EXCHANGE Program of the Greater Las Vegas Association of REALTORS® MLS. Real estate listings held by brokerage firms other than this site owner are marked with the IDX logo. Information is deemed reliable but not guaranteed. Copyright 2025 of the Greater Las Vegas Association of REALTORS® MLS. All rights reserved.
The data relating to real estate for sale on this web site comes in part from the INTERNET DATA EXCHANGE Program of the Greater Las Vegas Association of REALTORS® MLS. Real estate listings held by brokerage firms other than this site owner are marked with the IDX logo. Information is deemed reliable but not guaranteed. Copyright 2025 of the Greater Las Vegas Association of REALTORS® MLS. All rights reserved.